The RSI Indicator in Crypto: Overbought Oversold Indicator Explained
RSI Indicator in Crypto
The full form of RSI– Relative Strength Index
The Relative Strength Index is a popular tool crypto traders use to understand market trends and spot potential buying or selling opportunities.
It is especially helpful in the fast-moving world of cryptocurrencies like Bitcoin or Ethereum. This blog post will explain the RSI indicator in simple terms, focusing on its formula and how it signals overbought and oversold conditions perfect for beginners!
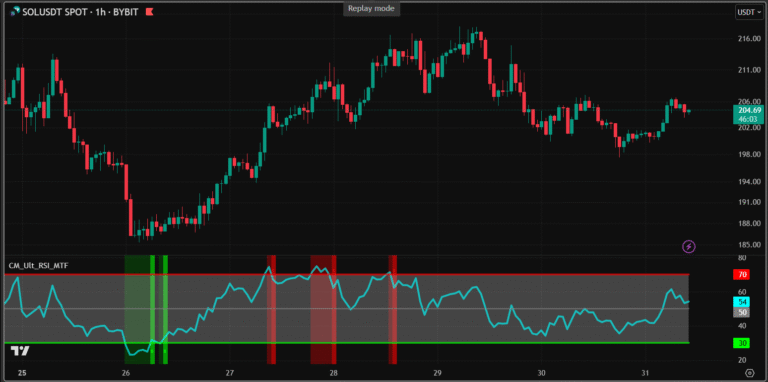
You can find RSI on any charting software on indicator or tools section. Such as tradingview, gocharting.
What is the RSI Indicator?
The RSI is a number between 0 and 100 that shows how strong or weak a crypto’s price movement is. It helps traders see if a cryptocurrency is:
- Overbought: The price has gone up too fast and might drop soon (RSI above 70).
- Oversold: The price has fallen too much and might rise soon (RSI below 30).
Think of it like a speedometer for price changes, it tells you if the market is moving too quickly in one direction, which could signal a reversal.
The RSI Indicator Formula
The RSI might sound technical, but its formula is straightforward once broken down. It is calculated in two easy steps using price data, typically over 14 days (or 14 price bars on a chart). Don’t worry, most trading platforms like Binance or TradingView do the math for you, but understanding it helps!
Step 1: Calculate the Relative Strength (RS)
The RS compares how much the price went up versus how much it went down over a period (usually 14 days).
- Average Gain: Add up all the price increases (when the price closes higher than the day before) and divide by 14.
- Average Loss: Add up all the price decreases (when the price closes lower than the day before) and divide by 14.
- RS Formula: RS= Average gain / average loss
For example, if Bitcoin’s price went up by $100 on 7 days and down by $50 on 7 days:
- Average Gain = $100 ÷ 14 = ~$7.14
- Average Loss = $50 ÷ 14 = ~$3.57
- RS = $7.14 ÷ $3.57 = ~2
Step 2: Turn RS into RSI
Now, plug the RS into this simple formula to get the RSI: RSI=100−100 /1 + RS
Using our example RS of 2:
RSI=100−100/1+2
= 100-100/3
=100-33.33
Rsi = 66.67
So, the RSI is about 67. This number tells you the momentum, closer to 100 means stronger upward movement, closer to 0 means stronger downward movement. This calculation is automatic done in rsi indicator.
Overbought and Oversold: What They Mean
The RSI helps spot when a crypto’s price might be ready to change direction:
- Overbought (RSI > 70): The price has climbed a lot, and buyers might be running out of steam. For example, if Ethereum’s RSI hits 75 after a big rally, it might be a sign to watch for a price drop as traders start selling.
- Oversold (RSI < 30): The price has fallen a lot, and sellers might be exhausted. If Bitcoin’s RSI drops to 25 after a crash, it could mean the price is due for a bounce as buyers step in.
Important: Crypto markets can stay overbought or oversold longer than you expect due to high volatility. Don’t rely on RSI alone, check other signals like support levels or news events.
How to Use RSI in Crypto Trading
Here’s how beginners can start using RSI:
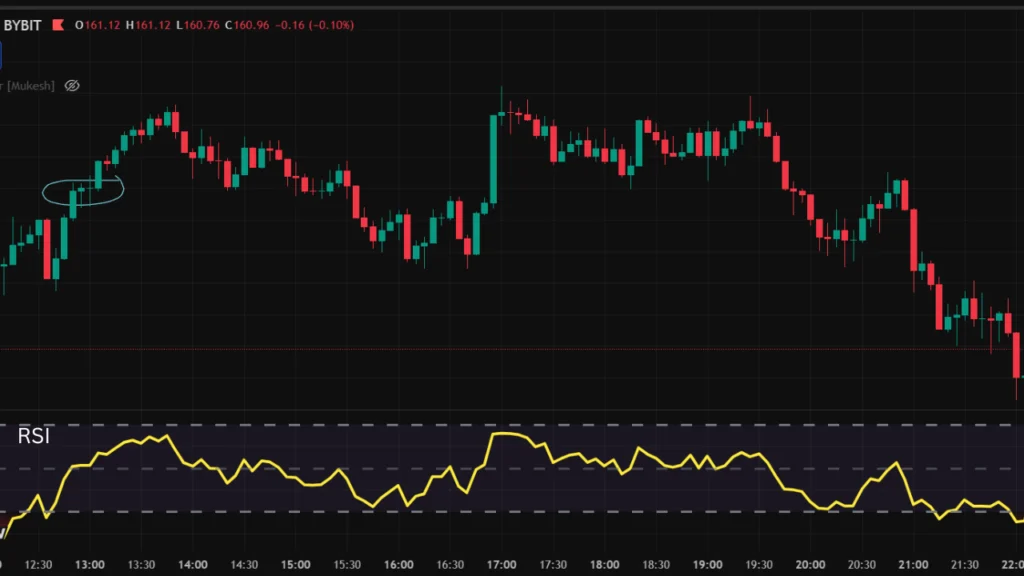
- Spot Extremes: Look for RSI above 70 (possible sell signal) or below 30 (possible buy signal).
- Watch the Trend: If RSI stays high (e.g., 60–70), the crypto might be in a strong uptrend. If it’s low (e.g., 30–40), it might be in a downtrend.
- Use with Other Tools: Combine RSI with simple chart patterns, like support or resistance lines, for better decisions.
- Spot Divergences: Watch for mismatches between price and RSI to catch reversals early.
- Practice First: Try RSI on a demo account on platforms like TradingView to get comfortable before trading real money.
RSI Divergence: A Hidden Signal
RSI divergence is a powerful way to spot potential trend changes by comparing the RSI to the price movement. It happens when the price and RSI move in opposite directions:
Bullish Divergence: The price makes a lower low (a bigger drop), but the RSI makes a higher low (less downward momentum). This suggests the downtrend is weakening, and a price rise might be coming. For example, if Bitcoin’s price drops to a new low but the RSI is higher than its previous low, it’s a sign buyers might step in soon.
Bearish Divergence: The price makes a higher high (a bigger rise), but the RSI makes a lower high (less upward momentum). This hints the uptrend is losing steam, and a price drop could follow. For instance, if Ethereum hits a new high but the RSI is lower than its previous peak, it might signal a reversal.
Divergences are like early warning signs, but they’re not foolproof. Combine them with other indicators, like support levels, to confirm signals.
Why RSI is Great for Crypto Beginners
The RSI is beginner-friendly because it is easy to read and available on every major crypto trading platform.
It gives you a clear snapshot of market momentum, helping you avoid buying at the top or selling at the bottom. However, crypto is unpredictable, so always use stop-losses and only trade what you can afford to lose.
Conclusion
The RSI indicator is like a guide for navigating crypto’s wild price swings. By understanding its simple formula and learning to spot overbought and oversold levels, you can make smarter trading choices.
Start by adding RSI to your charts, watch how it moves with prices, and pair it with other basic tools. With practice, you’ll be using RSI like a pro to tackle the crypto market!