Best RSI Settings for Day Trading: A Comprehensive Guide
Hey Traders, Welcome to cryptotradingin.com, here is detailed guide of rsi setting for day trading for crypto, forex, and stock trading.
The Relative Strength Index (RSI) is one of the most popular technical indicators for day trading, offering insights into price momentum and potential reversals.
Finding the best RSI settings for day trading depends on your trading style, market conditions, and the assets you trade, such as stocks, forex, or cryptocurrencies.
What is RSI and Why It Matters for Day Trading
The RSI, developed by J. Welles Wilder, is a momentum oscillator that measures the speed and change of price movements on a scale of 0 to 100.
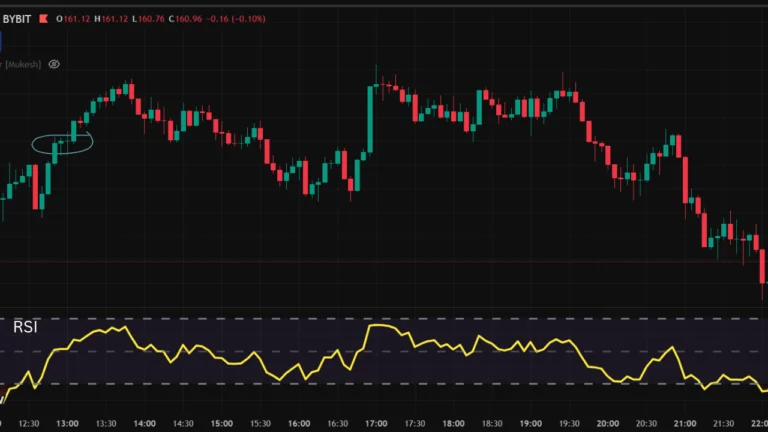
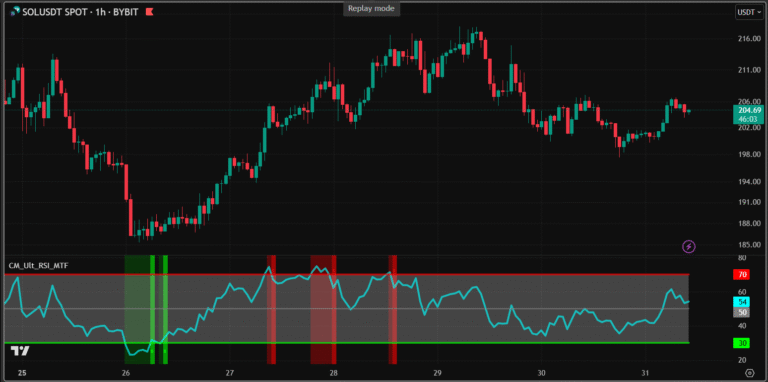
It helps traders identify overbought (typically above 70) and oversold (typically below 30) conditions, making it a go-to tool for day traders seeking quick entries and exits.
For day trading, where timing is critical, the right RSI settings can make the difference between catching profitable trades and falling for false signals.
Standard RSI Settings for Day Trading
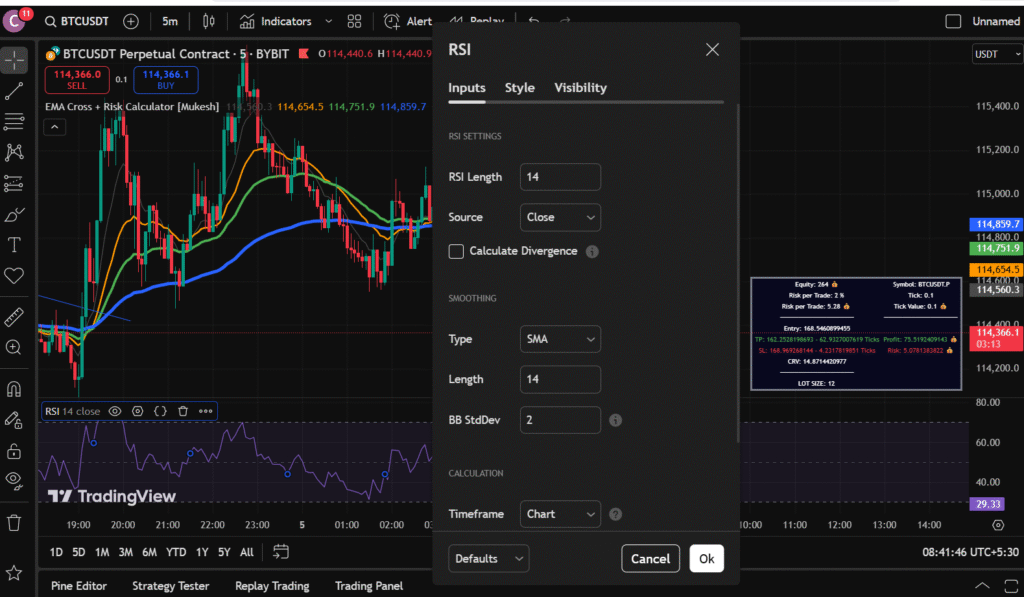
The default RSI settings, widely used by traders, are:
- Period: 14 (calculates momentum over 14 candles)
- Overbought Level: 70
- Oversold Level: 30
- Chart Timeframe: 5-minute, 15-minute, or 1-hour charts
Why Use the 14-Period RSI?
The 14-period RSI is the standard because it balances sensitivity and reliability:
- Sensitivity: Captures short-term price movements without excessive noise.
- Reliability: Smooths out minor fluctuations, reducing false signals.
- Versatility: Works across assets like stocks (e.g., AAPL, TSLA), forex (e.g., EUR/USD), and crypto (e.g., BTC/USD).
Example: On a 5-minute chart of a stock like NVIDIA, a 14-period RSI dropping below 30 might signal a buying opportunity, especially if confirmed by a support level or bullish candlestick pattern.
Alternative RSI Settings for Day Trading
While the 14-period RSI is a great starting point, tweaking settings can optimize performance for specific strategies or market conditions. Here are three alternative setups:
1. Short-Period RSI (7 or 9 Periods)
- Settings: 7 or 9-period RSI, 70/30 levels
- Best For: Scalping or high-volatility markets (e.g., crypto, forex)
- Why?: Shorter periods make RSI more sensitive, catching rapid momentum shifts common in intraday trading.
- Pros: Faster signals for quick trades.
- Cons: More false signals due to market noise.
- Example: A 7-period RSI on a 5-minute EUR/USD chart can help scalpers identify quick reversals during high-impact news events like Non-Farm Payrolls.
2. Long-Period RSI (21 Periods)
- Settings: 21-period RSI, 70/30 levels
- Best For: Trending markets or swing-style day trading
- Why?: A longer period smooths out price fluctuations, reducing whipsaws in choppy markets.
- Pros: Fewer false signals, better for stable assets like blue-chip stocks.
- Cons: Lags behind rapid price changes, potentially missing short-term opportunities.
- Example: On a 15-minute chart of SPY (S&P 500 ETF), a 21-period RSI staying above 50 can confirm an intraday uptrend.
3. Adjusted Overbought/Oversold Levels (80/20)
- Settings: 14-period RSI, 80/20 levels
- Best For: Strong trending markets (e.g., crypto bull runs, tech stock rallies)
- Why?: In trending markets, prices can stay overbought or oversold longer, so 80/20 levels filter out premature signals.
- Pros: Reduces early exits in strong trends.
- Cons: May miss opportunities in range-bound markets.
- Example: During a Bitcoin rally, a 14-period RSI with 80/20 levels on a 1-hour chart can help traders ride the trend longer.
How to Use RSI Effectively in Day Trading
To maximize the effectiveness of RSI, combine it with other tools and follow these strategies:
1. Combine RSI with Support and Resistance
- Use RSI alongside key support and resistance levels to confirm entries and exits.
- Example: On a 5-minute TSLA chart, wait for RSI to drop below 30 near a strong support level (e.g., $200) and a bullish engulfing candle before buying.
Keywords: RSI support resistance, price action trading, day trading confirmation, technical analysis.
2. Look for RSI Divergence
- Bullish Divergence: Price makes lower lows, but RSI makes higher lows, signaling a potential reversal up.
- Bearish Divergence: Price makes higher highs, but RSI makes lower highs, signaling a potential reversal down.
- Example: On a 15-minute GBP/USD chart, if price hits a new high but RSI shows lower highs, consider a short position.
3. Use Multiple Timeframes
- Align RSI signals across multiple timeframes for stronger confirmation.
- Example: On a 5-minute chart, an oversold RSI (below 30) is more reliable if the 1-hour chart also shows RSI below 30 or near a key level.
4. Pair RSI with Moving Averages
- Use moving averages (e.g., 50/200 EMA) to confirm trend direction before acting on RSI signals.
- Example: In an uptrend (price above 50 EMA), focus on oversold RSI signals for buy opportunities, ignoring overbought signals.
5. Avoid Over-Reliance on RSI
- RSI is not a standalone indicator. False signals are common in choppy or low-volume markets.
- Use volume analysis, candlestick patterns, or news events for context.
- Example: During a low-volume period (e.g., lunch hour in stocks), RSI signals may be less reliable.
Asset-Specific RSI Settings
Different assets have unique characteristics, so RSI settings may vary:
Cryptocurrencies
- Recommended: 7-period RSI, 80/20 levels, 1-hour chart
- Why?: Crypto markets are highly volatile, and shorter periods with wider levels help filter noise and catch trends.
- Tip: Watch for RSI divergence during Bitcoin or Ethereum pumps and dumps.
Stocks
- Recommended: 14-period RSI, 70/30 levels, 15-minute chart
- Why?: Stocks like AAPL or MSFT often follow predictable intraday patterns, and the 14-period RSI balances sensitivity and reliability.
- Tip: Use RSI with VWAP (Volume-Weighted Average Price) for better entry and exit timing.
Forex
- Recommended: 9-period RSI, 70/30 levels, 5-minute chart
- Why?: Forex markets are fast-moving, and a shorter RSI period captures rapid momentum shifts.
- Tip: Focus on high-liquidity pairs like EUR/USD or USD/JPY during major sessions (London, New York).
Backtesting RSI Settings
To find the best RSI settings for day trading, backtest on your chosen asset and timeframe:
- Use a Demo Account: Platforms like Thinkorswim, MetaTrader, or TradingView allow backtesting RSI settings.
- Test Variations: Try 7, 9, 14, and 21 periods with 70/30 and 80/20 levels.
- Measure Performance: Track win rate, risk-reward ratio, and drawdowns.
- Example: Backtest a 9-period RSI on a 5-minute EUR/USD chart over 100 trades to compare win rates with a 14-period RSI.
Common Mistakes to Avoid
- Trading RSI Signals in Isolation: Always confirm with price action or other indicators.
- Ignoring Market Context: RSI works poorly in low-volatility or news-driven markets.
- Using Inappropriate Timeframes: A 1-minute chart may be too noisy, while a 4-hour chart is too slow for day trading.
- Not Adjusting for Volatility: Use shorter periods for volatile assets like crypto, longer for stable stocks.
Sample RSI Day Trading Strategy
Here’s a simple RSI-based day trading strategy for a 15-minute chart:
- Asset: Any high-liquidity stock (e.g., AAPL) or forex pair (e.g., EUR/USD).
- Settings: 14-period RSI, 70/30 levels, 50 EMA.
- Buy Signal:
- RSI drops below 30 (oversold).
- Price is near a support level or above the 50 EMA.
- Confirm with a bullish candlestick (e.g., hammer, engulfing).
- Sell Signal:
- RSI rises above 70 (overbought).
- Price is near a resistance level or below the 50 EMA.
- Confirm with a bearish candlestick.
- Risk Management:
- Set a stop-loss below recent swing low (for buys) or above swing high (for sells).
- Target a 2:1 risk-reward ratio.
- Example: On a 15-minute AAPL chart, buy when RSI is below 30, price is above the 50 EMA, and a bullish engulfing forms. Set a stop-loss 1% below and target a 2% gain.
Conclusion
The best RSI settings for day trading depend on your trading style, asset, and market conditions. The 14-period RSI with 70/30 levels is a reliable starting point for most traders, offering a balance of sensitivity and accuracy.
For scalping or volatile markets, try a 7 or 9-period RSI; for trending markets, consider a 21-period RSI or 80/20 levels. Always combine RSI with other tools like support/resistance, moving averages, or divergence for better results. Backtest your settings on a demo account and adapt to your specific market (stocks, forex, crypto).
By fine-tuning your RSI settings and integrating them into a disciplined trading plan, you can enhance your day trading performance and make more informed decisions. Start with the strategies outlined here, test them, and adjust based on your results. Happy trading!
Disclaimer: The information provided in this blog post is for educational and informational purposes only and is not intended as financial or investment advice. Day trading involves significant risks, including the potential loss of your entire investment. Always conduct your own research and consult with a qualified financial advisor before making any trading decisions. The author and publisher are not responsible for any financial losses or damages resulting from the use of this information.
Other Helpful
- Best Crypto Trading Platforms in 2025
- 5 Best Decentralized Launchpads
- How To Use Pancakeswap For Altcoin Trading For Beginners
- Strategy Backtester
Contents