Best Setting ATR Indicator on TradingView And Combining With Other Indicators
ATR Indicator
In the unpredictable arena of financial trading, understanding volatility is like having a compass in a storm, it guides you through turbulent markets and helps manage risks effectively.
For those using TradingView, the Average True Range (ATR) indicator emerges as a go-to tool for quantifying price fluctuations. Whether you are scalping crypto, forex pairs, swing trading stocks, or navigating crypto’s wild swings, ATR provides actionable insights into how much an asset might move, aiding in stop-loss placement and position sizing.
If you have ever wondered why some trades get stopped out prematurely or why others miss big moves, ATR could be the missing piece in your strategy.
This guide dives into the nuts and bolts of ATR on TradingView, from its fundamentals to advanced applications. We will cover setup tips, real-world strategies, and common mistakes to avoid.
By the end, you will be ready to incorporate ATR into your charts for smarter, more resilient trading. Let’s unpack this essential volatility measure and see how it can elevate your game in 2025’s dynamic markets.
Read: Lot Size Calculator
What is the ATR Indicator?
The Average True Range, or ATR, is a technical indicator that measures market volatility by calculating the average range of price movements over a specified period.
Developed by J. Welles Wilder, the same mind behind RSI and Parabolic SAR- ATR focuses on the “true” range, which accounts for gaps and limit moves that standard range calculations might miss.
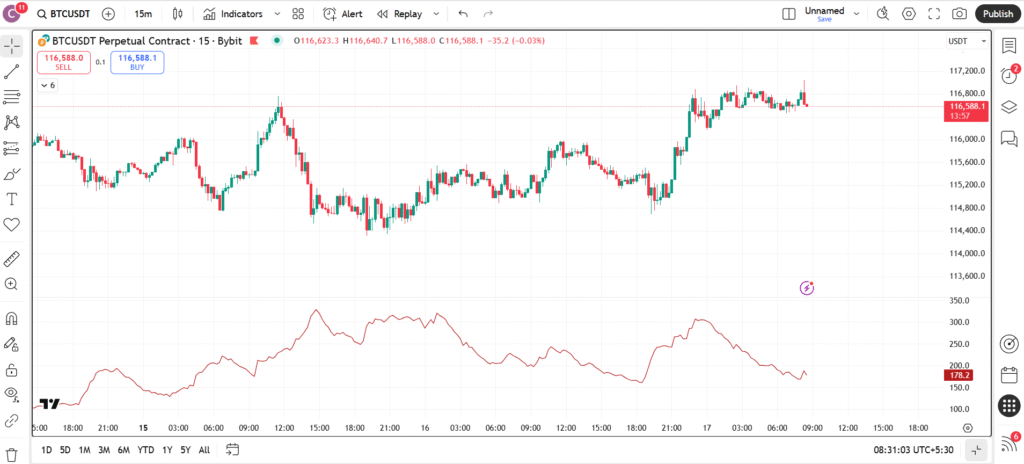
On TradingView, ATR displays as a single line below your price chart, typically smoothed over 14 periods. It does not predict direction but quantifies how much prices are swinging, helping you gauge if a market is heating up or cooling down.
Higher ATR values signal increased volatility, while lower ones indicate consolidation.
Why is ATR indispensable? In an era of flash crashes and meme stock frenzies, it helps traders set realistic expectations. For instance, in calm markets, tight stops work; in volatile ones, wider buffers prevent unnecessary exits. It’s asset-agnostic, shining in everything from commodities to indices.
Read: Why Backtesting Does not Work for Every Crypto Trader
The History and Evolution of ATR
J. Welles Wilder introduced ATR in his 1978 book “New Concepts in Technical Trading Systems,” alongside other classics like RSI. Originally designed for commodities, where gaps are common, ATR addressed the shortcomings of simple high-low ranges by including prior closes.
Over the decades, ATR has evolved with trading tech. Early manual calculations gave way to automated platforms like TradingView, which now offer variations like Wilder’s ATR or smoothed versions.
In the 21st century, it’s integral to algorithmic trading and risk models, especially post-2008 financial crisis when volatility spiked.
Today, in 2025, ATR adapts to AI-driven strategies and crypto’s 24/7 nature. Its simplicity endures, but integrations with machine learning for adaptive periods keep it cutting-edge.
How Does the ATR Indicator Work?
ATR’s calculation starts with the True Range (TR): The greatest of current high minus low, high minus previous close (absolute), or low minus previous close (absolute). This captures overnight gaps.
Then, ATR averages these TRs over a period, usually 14, using a smoothing method like Wilder’s (a type of exponential average).
The formula: Current ATR = [(Prior ATR x 13) + Current TR] / 14.
On TradingView, this plots as a rising/falling line: Spikes indicate volatility bursts, like during earnings; drops suggest ranging.
ATR is non-directional, rising in both uptrends and downtrends if swings widen. This makes it a pure volatility tool, complementing trend indicators.
Understanding True Range
True Range ensures gaps aren’t ignored. For example, if a stock closes at $50 and opens at $55, TR includes that $5 jump, even if intraday range is small.
This realism sets ATR apart from volatility measures like standard deviation, which might understate jumps.
ATR Periods and Smoothing
Default 14 balances sensitivity and reliability. Shorter (7) for day trading captures quick changes; longer (20) for swings smooths noise.
TradingView offers EMA or SMA variants, but Wilder’s method weights recent data, reacting faster to volatility shifts.
Setting Up ATR on TradingView For Best Setup
Adding ATR to your TradingView chart is quick and intuitive. Log in, open a chart for your asset, perhaps Nasdaq futures or Solana. Hit the “Indicators” button, search “ATR,” and select “Average True Range.”
Defaults: 14-period length, Wilder’s smoothing.
Customize via settings: Change to 10 for intraday, add multipliers for channels.
Style the line, thicken for visibility, add colors based on thresholds (e.g., red for high volatility). Overlay on price or keep sub-panel.
TradingView’s alerts shine here: Notify when ATR exceeds a value, signaling potential breakouts.
Customizing ATR for Specific Markets
Tailor to your niche. In forex, use 14 on hourly for major pairs like AUD/USD, volatile during news.
Stocks: Lengthen to 20 around earnings season to filter spikes.
Crypto: Shorten to 7 on 15-minute charts for rapid swings, combine with volume for confirmation.
Use TradingView’s backtester: Apply ATR-based rules to historical data, optimizing periods without curve-fitting.
Mobile and Advanced Setup Tips
TradingView’s app supports full ATR customization. For pros, layer multiple ATRs (short/long) for volatility crossovers.
Explore Pine Script: Code custom ATR bands or integrate with strategies.
You can take help of chatgpt, gemini for code setting or strategy create.
Interpreting ATR Values
ATR readings are relative, compare to historical norms. A stock with average ATR of 2 might spike to 5 during volatility, signaling caution.
Use multipliers: 2x ATR for stops gives breathing room. In trends, rising ATR confirms strength; falling suggests exhaustion.
On TradingView, add horizontal lines at key levels (e.g., 50-day ATR average) for quick context.
Low ATR? Expect ranges, scalpers thrive. High? Trends or breakouts likely, position accordingly.
Using ATR for Risk Management
ATR excels in sizing trades and setting stops. Calculate position size: Risk 1% of capital divided by ATR, ensures consistent exposure.
Stops: Place 1-2x ATR from entry to avoid noise. Trailing stops: Subtract ATR from highs in uptrends.
This quantifies “volatility-adjusted” risk, preventing overexposure in wild markets.
Basic Trading Strategies with ATR
ATR underpins many approaches. Volatility Breakout: Enter when price breaks range plus 1x ATR, expecting expansion.
ATR Channels: Plot lines ±ATR from a moving average, buy lows, sell highs in ranges.
For day traders: Filter entries- only trade if ATR > average, ensuring movement.
Backtest on TradingView: Define ATR thresholds, simulate profits/drawdowns.
ATR Stop-Loss Strategy
Set initial stop 1.5x ATR below entry for longs. Trail by subtracting ATR from new highs, locks profits while allowing wiggles.
Ideal for trending stocks like in tech booms.
Volatility Filter Strategy
Skip trades if ATR < 0.5x historical average- avoids dead markets.
Combine with MACD: Crossover + high ATR = strong signal.
Combining ATR with Other Indicators
ATR amplifies others. With Bollinger Bands: ATR spikes during squeezes predict breakouts.
RSI: Oversold + low ATR suggests mean reversion; high ATR warns of continuations.
On TradingView, add as inputs, e.g., ATR-normalized RSI for volatility-adjusted overbought.
ATR and Moving Averages
Use ATR multiples around EMAs for channels: Price touching lower band in uptrend = buy.
Filters trends: Rising MA + increasing ATR = ride the wave.
ATR with Volume
High ATR + surging volume confirms breakouts. TradingView’s volume profile aligns with ATR levels for support.
Low volume + high ATR? Potential fakeouts, proceed cautiously.
Advanced ATR Applications
Elevate with ATR Ratio: Current ATR / historical, above 1 signals volatility upticks.
Multi-timeframe: Daily ATR for position size, hourly for entries.
In options: ATR estimates implied moves, comparing to IV.
Pine Script custom: ATR-based trailing exits or adaptive periods.
ATR in Scalping
On 1-minute charts, use 5-period ATR for tight stops, scalp when ATR expands post-news.
High-frequency edge in forex overlaps.
ATR for Position Sizing in Portfolios
Scale lots based on ATR: Lower volatility assets get bigger allocations for balanced risk.
TradingView scanners: Sort watchlists by ATR for opportunity spotting.
Pros and Cons of Using ATR on TradingView
Strengths: Objective volatility measure, versatile across assets, enhances risk control. TradingView’s real-time calc makes it responsive.
Weaknesses: Lagging, reacts after volatility changes. Doesn’t indicate direction, so pair with trends. Can mislead in gaps-heavy markets if not adjusted.
Maximizing ATR Benefits
Leverage for adaptive strategies: Auto-adjust stops in bots via webhooks.
In low-vol environments, ATR highlights boredom, switch to ranges.
Avoiding ATR Pitfalls
Don’t use absolute values across assets- $5 ATR means different for Apple vs. penny stocks.
Ignore in illiquid markets: Sparse data inflates ranges.
Over-optimize periods, stick to tested defaults.
Real-World Examples of ATR in Action
During 2024’s crypto winter thaw, Bitcoin’s ATR spiked from 1000 to 3000, signaling the bull run, traders widened stops, capturing gains.
In stocks, Tesla’s earnings: ATR doubled pre-report, warning of swings, smart positioning avoided whipsaws.
Forex: USD/JPY intervention in 2025, ATR surges flagged volatility, aiding scalps.
Study on TradingView replays for pattern recognition.
Case Study: ATR in Commodity Trading
Oil’s 2025 geopolitical tensions: Rising ATR confirmed uptrends, with channels guiding entries, yielded steady profits.
Tips for Beginners Using ATR on TradingView
Start simple: Add to daily charts, note how ATR correlates with news.
Practice stops: Demo trade with 2x ATR buffers.
Learn relativity: Compare ATR to price, 1% daily move is huge for stable assets.
Communities: TradingView ideas showcase ATR setups.
Avoid solo use: Always contextualize with price action.
Advanced Tips for Experienced Traders
Incorporate into EAs: Code ATR filters in strategies.
Multi-asset: Normalize ATR as percentage for comparisons.
Forecast: Project ATR for expected moves in options expiry.
ATR vs. Other Volatility Indicators
Vs. Bollinger Bands Width: ATR purer measure, Bands add direction.
Vs. VIX: ATR asset-specific; VIX market-wide.
Vs. Standard Deviation: ATR handles gaps better.
Test contrasts on TradingView.
The Future of ATR in Trading
As markets digitize, ATR evolves with AI predicting ranges from on-chain data.
In 2025, integrations with sentiment tools could volatility-adjust further.
TradingView may add ML-enhanced ATR variants, watch updates.
Conclusion: Harness ATR for Smarter Volatility Management on TradingView
The ATR indicator is a cornerstone for any trader on TradingView, turning abstract volatility into tangible strategy elements. From risk sizing to signal filtering, its applications build robust systems.
Ready to try? Load ATR on your charts, experiment with setups, and track results. With practice, it’ll become your volatility ally. What is your ATR strategy? Share in comments, let’s discuss!
Read: Best Crypto Trading Platforms in 2025
Contents
- 1 ATR Indicator
- 1.1 What is the ATR Indicator?
- 1.2 The History and Evolution of ATR
- 1.3 How Does the ATR Indicator Work?
- 1.4 Setting Up ATR on TradingView For Best Setup
- 1.5 Interpreting ATR Values
- 1.6 Using ATR for Risk Management
- 1.7 Basic Trading Strategies with ATR
- 1.8 Combining ATR with Other Indicators
- 1.9 Advanced ATR Applications
- 1.10 Pros and Cons of Using ATR on TradingView
- 1.11 Real-World Examples of ATR in Action
- 1.12 Tips for Beginners Using ATR on TradingView
- 1.13 Advanced Tips for Experienced Traders
- 1.14 ATR vs. Other Volatility Indicators
- 1.15 The Future of ATR in Trading
- 1.16 Conclusion: Harness ATR for Smarter Volatility Management on TradingView