Combining RSI, MACD & 200 EMA trading strategy in Pinescript: An Educational Guide

Combining RSI, MACD & 200 EMA trading strategy
Hey traders, In the ever evolving world of cryptocurrency and stock trading, technical indicators serve as the foundation of a successful trading strategy.
Among the multitude of tools available, three stand out due to their proven reliability and widespread use: the Relative Strength Index (RSI), the Moving Average Convergence Divergence (MACD), and the 200 Exponential Moving Average (EMA).
This article provides an in-depth breakdown of how to combine these indicators into a single, powerful momentum based strategy designed to increase your win rate, reduce noise, and optimize trade entries and exits.
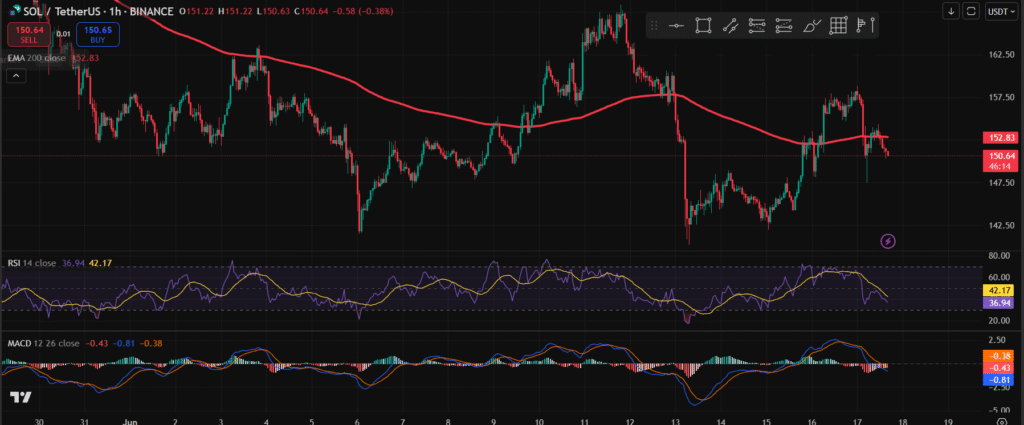
This guide is structured to take you from basic concepts to advanced applications, with real-world insights from implementation in the SOLUSDT 5 minute chart a favorite among high-frequency traders.
Whether you’re a beginner or a seasoned trader, this human-written breakdown will make sure you understand every moving piece of this strategy and know exactly how to use it.
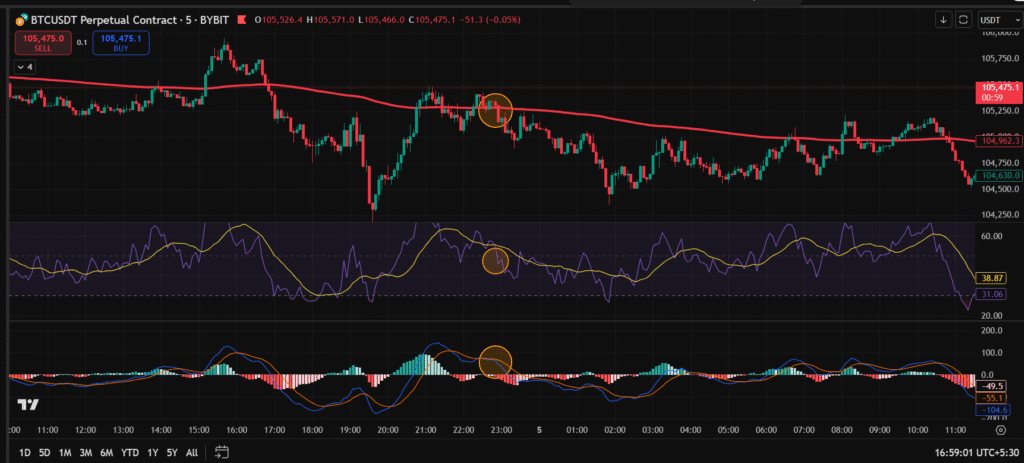
What is the strategy
This is 3 indicater based confirmation strategy. High win rate if you trade in volatile market not in sideways.
In this strategy we use three indicaters- RSI, EMA 200 And MACD. read bellow for complete strategy pinescript dowload and trade setup.
Understanding the Indicators
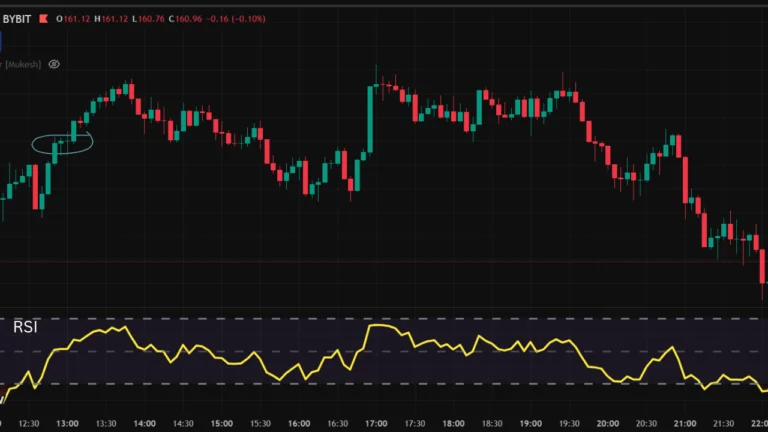
1. Relative Strength Index (RSI)
The RSI is a momentum oscillator developed by J. Welles Wilder. It measures the speed and change of price movements and ranges between 0 and 100. Traditionally, RSI values above 70 indicate overbought conditions, while values below 30 indicate oversold conditions.
In our strategy:
- A bullish signal is confirmed when RSI crosses above 50.
- A bearish signal is confirmed when RSI crosses below 50.
- This filter ensures trades align with momentum rather than against it.
2. Moving Average Convergence Divergence (MACD)
MACD is a trend following momentum indicator that shows the relationship between two moving averages of a security’s price.
- MACD Line: 12-period EMA minus 26-period EMA
- Signal Line: 9-period EMA of MACD Line
In our strategy:
- Bullish confirmation happens when MACD line crosses above the signal line.
- Bearish confirmation happens when MACD line crosses below the signal line.
This indicator confirms the direction of the trend and eliminates false signals.
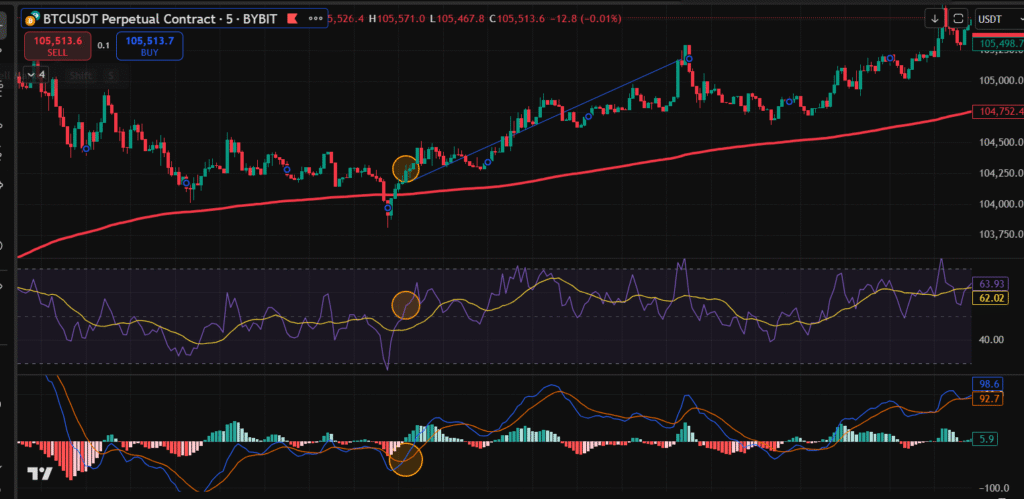
3. 200 EMA (Exponential Moving Average)
The 200 EMA is a long-term trend filter.
In our strategy:
- Only long trades are allowed when price is above the 200 EMA.
- Only short trades are allowed when price is below the 200 EMA.
This ensures that trades are always taken in the direction of the dominant trend.
The Strategy Logic
This trading strategy is built on the synergy between RSI, MACD, and the 200 EMA. It is designed for high-probability trade entries and strong risk management.
Entry Conditions
For Long (Buy) Positions:
- Price is above the 200 EMA – trend filter
- RSI crosses above 50 – confirms bullish momentum
- MACD line crosses above the Signal line – momentum confirmation
For Short (Sell) Positions:
- Price is below the 200 EMA – trend filter
- RSI crosses below 50 – confirms bearish momentum
- MACD line crosses below the Signal line – momentum confirmation.
Exit Conditions
The strategy uses a fixed Stop Loss and Take Profit based on Risk:Reward ratio
- Stop Loss: Low (for longs) or High (for shorts) of the entry candle
- Take Profit: 3 times the risk distance (1:3 RR)
This ensures a tight risk management model while maximizing reward per successful trade.
Optional: Trailing Stop Loss
For traders who prefer dynamic risk management, a trailing SL can be implemented that moves every time price moves in favor by a certain tick size (example., every 0.05 USDT).
Backtesting and Optimization
This strategy has shown excellent performance on SOLUSDT 5-minute charts, where the volatility and liquidity make it ideal for such momentum-based systems.
Key Findings from 6-Month Backtest:
- Strategy stays profitable each month in solusdt 5min.
- 70%+ win rate when properly filtered
- Higher accuracy in trending markets
- Low drawdown due to strict SL
Fine-Tuning Parameters:
- RSI threshold can be adjusted slightly (e.g., 55 or 45)
- MACD settings can be tested for fast-moving pairs (e.g., 8, 21, 5)
- EMA filter can be toggled off for ranging markets
Real-World Implementation
Platform: TradingView + Delta Exchange (Webhook Automation)
With this strategy coded in Pine Script, users can:
- Set alerts directly in TradingView using
alertcondition() - Send webhook messages to Delta Exchange for automation
- Trade fully automatically with trailing SL and TP levels included. Go below to download pinecode.
Example Webhook Message:
{
  "symbol": "SOLUSDT",
  "side": "buy",
  "order_type": "market",
  "size": 100,
  "leverage": 5,
  "stop_loss": 150.70,
  "take_profit": 153.45
}
This enables traders to scale and remove emotion from their trades.
Pros and Cons
Pros:
- High probability entries
- Works well in trending markets
- Strong risk management
- Easy to automate
- Customizable for any asset
Cons:
- Doesn’t perform well in sideways and ranging markets
- Requires volume to confirm breakout
- Might miss early reversal trades
Tips for Best Results
- Use on assets with strong volatility (like SOL, ETH, BTC)
- Avoid during news events or low volume sessions
- Always backtest and forward test before live deployment
- Use alerts with Webhook for full automation
- Monitor PnL weekly and refine if needed
Download the Strategy Code
For traders who want to test or automate this strategy, we’ve made the Pine Script code available for direct use in TradingView.
This is backtest ready pinecode, with trailing SL, Paste in tradingview pine editer and check in strategy.
Download the RSI + MACD + 200 EMA Pine Script Strategy
The script includes:
- Full entry and exit logic
- Webhook ready alerts
- Custom risk-reward controls
- Easy toggles for EMA, RSI, MACD settings.
First backtest and check proper signals before apply.
You can copy it into the Pine Script editor on TradingView and begin testing right away.
Disclaimer
No trading strategy, including the RSI + MACD + 200 EMA method, can get success in all market conditions. This strategy has been optimized for specific pairs and timeframes (like SOLUSDT 5-minute), but performance can vary across different assets and market phases.
Backtest results do not guarantee future performance. Please practice proper risk management, and never invest more than you can afford to lose. Always do your own research and forward test before live deployment. We do not take any responsibility for trading losses.
Conclusion
The combination of RSI, MACD, and 200 EMA forms a robust, momentum-based trading strategy ideal for scalping or swing trading in crypto and forex markets.
With its clear entry and exit rules, smart trend filtering, and adaptability to automation platforms like Delta Exchange via TradingView webhooks, this strategy empowers traders to make data driven decisions with confidence.
Whether you are a manual trader or looking to build a semi-automated trading bot, the RSI + MACD + 200 EMA strategy is a strong foundation for consistent performance in the markets.
I hope you must liked this trading strategy, first backtest this strategy before apply. Thanks.
Disclaimer: Always do your own research. Crypto investing carries risk. This content is educational based, not financial advice.