Best TradingView Indicators: Top Tools for Technical Analysis in 2025
Understanding Technical Indicators
Every trader have tradingview favourite every. And with tradingview indicators trader become more profitable. So today I am going to share some best and smart tradingview indicators.
What Are Indicators and Why Use Them?
A technical indicator is a calculation based on price, volume, or open interest that is plotted on a chart. It helps traders forecast future price movements based on historical data.
Some indicators analyze trends, some gauge momentum, while others examine volatility or volume.
Here is why traders use indicators:
- To identify trends (bullish or bearish)
- To time entries and exits
- To confirm signals from price action
- To spot divergences that may indicate reversals
- To filter noise and reduce emotional trading
Indicators provide structure in an otherwise chaotic environment. When you are staring at candlestick charts with no context, indicators give meaning to those price movements.
Lagging vs Leading Indicators Explained
In TradingView, indicators typically fall into two categories
- Lagging Indicators – These follow the market and are used to confirm trends after they have started. Examples: Moving Averages, MACD, Bollinger Bands.
- Best for: Trend-following strategies
- Downside: Late signals, may miss tops or bottoms.
- Leading Indicators – These try to predict future movements. They give signals before a new trend starts. Examples: RSI, Stochastic Oscillator, Fibonacci retracements.
- Best for: Reversal or momentum strategies
- Downside: Higher false positives
Good traders usually combine both types to get confirmation and reduce false signals. For example, using RSI for entry signals and a Moving Average for trend confirmation
My favourite Best TradingView Indicators
- Smart Money Concepts (Lux algo)
- RSI
- VWAP
- EMA (Most Powerful indicator)
- Position Size Calculater (dr)
Built-in Best TradingView Indicators
Relative Strength Index (RSI)
The RSI is a staple in any trader’s toolbox. It measures the speed and change of price movements, oscillating between 0 and 100.
Traditionally, values above 70 indicate an overbought market, while below 30 suggest oversold conditions.
Why RSI rocks:
- Easy to interpret
- Works across all markets and timeframes
- Great for spotting divergences and trend reversals
In 2025, RSI has evolved beyond basics. Many traders use Multi-Timeframe RSI or RSI Divergence Indicators to get a deeper read.
On TradingView, dozens of enhanced RSI scripts allow for alerts, auto detection of divergences, and even dynamic zones based on volatility.
This is top indicator from Best TradingView Indicators.
Moving Averages (MA, EMA, SMA)
Moving Averages smooth out price action, helping traders identify the direction of a trend. They come in various forms:
- SMA (Simple Moving Average) – Equal weight for each period
- EMA (Exponential Moving Average) – More weight on recent data
Traders often use crossovers to signal entries:
- A Golden Cross (50 EMA crossing above 200 EMA) signals a bullish trend.
- A Death Cross (50 EMA below 200 EMA) signals bearish momentum.
Popular combinations:
- 9 EMA and 21 EMA (for short-term trades)
- 50 and 200 EMA (for long-term trend analysis)
TradingView allows you to overlay multiple MAs with color coding, alerts, and even backtesting features to perfect your strategy.
Best Custom TradingView Indicators
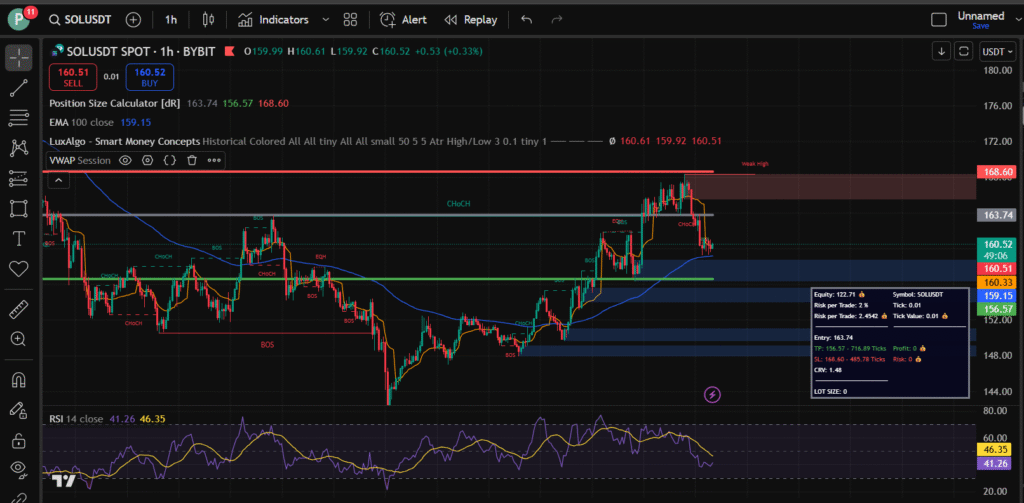
Smart Money Concepts (LuxAlgo)
One of the most popular premium indicators on TradingView today is LuxAlgo. Designed for traders who want to do trading on SMC concepts.
This indicator have cleaner, smarter signals, LuxAlgo combines advanced algorithms with real-time Choch, BOS, And order block alerts and customization options. It is not just another, buy and sell tool, it is a complete trading suite.
Key Features of SMC Lux algo:
- Smart Signals: Order blocks, FVG, CHOch, BOS (For SMC Traders).
- Trend Confirmation Tools: Including trend catcher overlays and support and resistance detectors.
- Customizable Settings: Tweak sensitivity and signal strength to match your trading style.
- Auto Trendlines & Order Blocks: LuxAlgo automatically draws them on your charts.
- Dashboard Interface: You get a high level view of all market conditions instantly.
Market Cipher
Another powerhouse in the custom indicator space is Market Cipher, made famous in crypto trading circles. It is a paid indicator suite that combines several different tools into one.
Core Components:
- Market Cipher A: Provides EMA ribbons and trend indications.
- Market Cipher B: Combines momentum waves, money flow index (MFI), and VWAP in one sleek panel.
- Market Cipher SR: Highlights support and resistance zones and potential reversal points.
Market Cipher is incredibly detailed. It takes some time to learn, but once you master it, you can see market sentiment, momentum shifts, and hidden divergences with ease.
It is perfect for crypto, but equally powerful for forex and stocks.
The catch? It is a premium tool and may be overwhelming for absolute beginners. However, for intermediate and advanced traders, it is worth every dollar.
Trend-Following Indicators
SuperTrend
SuperTrend is a fan favorite on TradingView, especially for beginners looking for simplicity. It plots a line over the chart that shifts based on trend direction.
When the price is above the SuperTrend line, the trend is bullish. When below, it is bearish.
Why It is Useful:
- Combines price action and volatility
- Helps confirm entries and exits
- Great with other tools like RSI or MACD
Custom scripts often pair SuperTrend with other indicators to enhance accuracy. For example, SuperTrend + RSI Divergence is a killer combo for spotting early trend shifts.
ADX (Average Directional Index)
ADX is used to measure the strength of a trend, not the direction. It works alongside two other lines: +DI and -DI, which indicate bullish and bearish pressure.
How Traders Use It:
- ADX above 25 = strong trend
- ADX below 20 = weak or sideways market
The ADX does not predict direction, but when paired with other indicators, it confirms whether a trend is worth trading or not. In 2025, many TradingView scripts offer colored ADX lines, alerts for breakouts, and built-in filters to make this tool even more efficient.
Momentum Indicators
MACD (Moving Average Convergence Divergence)
The MACD remains one of the most trusted indicators in technical analysis. It tracks momentum and trend direction by comparing two moving averages.
Components:
- MACD Line (fast-moving)
- Signal Line (slower)
- Histogram (shows the gap between MACD and Signal)
Signals to Watch:
- Crossover: When MACD crosses above Signal = bullish
- Divergence: If MACD diverges from price, a reversal may be coming
- Histogram Shift: Indicates momentum change
MACD is incredibly versatile. Use it alone or with volume indicators for extra confirmation. There are advanced TradingView versions that integrate RSI, alerts, or color code trends for easier analysis.
Stochastic Oscillator
The Stochastic Oscillator compares a closing price to its price range over a given period. It is ideal for spotting overbought or oversold conditions.
Key Zones:
- Over 80 = overbought
- Under 20 = oversold
Stochastic works well in ranging markets and can pinpoint reversal points before they happen. In 2025, traders use Stochastic RSI, a hybrid of the two tools, for even better signals.
The newer TradingView scripts include MTF (multi-timeframe) versions, signal line smoothing, and dynamic zones based on volatility.
Volume-Based Indicators
Volume Profile
Volume Profile is a powerful tool that shows trading activity across different price levels. Instead of looking at volume over time (traditional volume bars), Volume Profile displays where most of the trading occurred in relation to price.
Why It is Valuable:
- Identifies key price levels like Point of Control (POC), the price with the highest volume.
- Reveals support and resistance zones with high trading interest.
- Helps spot price acceptance vs. rejection zones.
Volume Profile is widely used by professional day traders, swing traders, and even institutional desks. In TradingView, you will find both basic and premium versions.
The Fixed Range Volume Profile is especially useful for analyzing specific moves, while the Session Volume Profile helps intraday traders gauge supply and demand during market hours.
On-Balance Volume (OBV)
OBV is one of the simplest yet most effective volume indicators. It adds volume on up days and subtracts it on down days, creating a cumulative line that reflects buying or selling pressure.
When to Use OBV:
- To confirm trends: If OBV and price move together, the trend is strong.
- To spot divergences: If price goes up but OBV flattens or drops, it may hint at a reversal.
OBV works great with momentum indicators like RSI or MACD. In 2025, TradingView includes OBV alerts, and some scripts even plot OBV divergences automatically, helping you spot hidden signals without the guesswork.
Read: Best Crypto Trading Platforms in 2025
Volatility Indicators
Bollinger Bands
Created by John Bollinger, Bollinger Bands are a classic tool for measuring market volatility. They consist of a middle SMA line and two outer bands plotted at standard deviations above and below the SMA.
Key Concepts:
- Tight bands = low volatility, expect a breakout.
- Widening bands = high volatility, trend already in motion.
- Price touches band = potential reversal or breakout confirmation.
Bollinger Bands are great for scalping and swing trading. Traders often use ‘Bollinger Band Squeeze‘ setups to prepare for explosive price moves.
Custom versions on TradingView now include additional filters like Bollinger Band Width or dynamic RSI overlays.
Keltner Channels
Keltner Channels are similar to Bollinger Bands but use Average True Range (ATR) to set the distance from the EMA. The result? A smoother, more stable set of bands that are less prone to sudden price spikes.
Advantages:
- Smoother than Bollinger Bands
- Great for breakout strategies
- More consistent in trending markets
Many traders use Keltner Channels together with Bollinger Bands. If price breaks both indicators’s bands simultaneously, it could signal a high-probability move. TradingView’s newer indicators even alert you when a “Keltner Breakout” occurs, so you can act fast.
Support and Resistance Indicators
Pivot Points
Pivot Points are calculated from the high, low, and close of the previous session and project key levels for the current session: support (S1, S2, S3) and resistance (R1, R2, R3).
Use Cases:
- Scalpers and day traders use them for intra-day levels.
- Swing traders spot long-term support resistance zones.
- Combine with price action for precision entries.
TradingView includes a built-in Pivot Point tool, but you will also find custom versions that include automatic labeling, alerts, and confluence with Fibonacci levels.
Auto Support and Resistance by Patternsmart
This popular custom indicator automatically detects horizontal support and resistance levels using advanced pattern recognition. It simplifies chart analysis and reduces subjectivity.
Why It is Powerful:
- No manual drawing required
- Updates in real-time
- Great for setting stop-loss and take-profit levels
In 2025, Patternsmart’s tools remain among the top-rated community scripts. If you are tired of guessing where the key levels are, this script gives you a cleaner and more professional edge.
Best Free Indicators on TradingView
Community Scripts Worth Exploring
One of the most powerful aspects of TradingView is its community-driven indicator library. Thousands of developers and traders publish their custom scripts for public use, many of which are completely free.
These community scripts often blend classic tools with modern functionality or create entirely new indicators tailored to current market needs.
Top Free Community Indicators in 2025:
- QQE Mod – A smoothed version of the RSI with trend confirmation.
- DMI/ADX Oscillator Combo – Combines directional movement with momentum strength.
- Auto Fib Retracement – Automatically plots Fibonacci levels based on recent swings.
- ZLSMA (Zero-Lag Smoothed Moving Average) – Great for trend-following strategies with minimal lag.
You will also find community-created multi-timeframe indicators, divergence finders, liquidity zones, and candlestick pattern detectors. Before spending money on a premium tool, many traders experiment with these powerful free options.
Free vs Paid
It is tempting to think paid indicators are always better, but that is not necessarily true. Many free TradingView indicators offer professional level analysis and can be customized to your strategy. The key is understanding your needs.
When Free Tools Are Enough:
- You are just starting and need core indicators.
- You want to test strategies without paying.
- You prefer customizing with Pine Script.
When Premium Tools Are Worth It:
- You need simplified signals for fast decisions.
- You trade large accounts and value real time edge.
- You want multiple indicators in one unified tool.
A smart strategy is to start with free tools and scale up as you get more advanced. Several premium indicators also offer free trials or demo access, use those to test compatibility with your strategy.
How to Combine Indicators for Maximum Effectiveness
Indicator Stacking for Confirmation
No indicator works in isolation. The most successful traders combine multiple indicators to confirm entries and exits. This practice, known as confluence, boosts your win rate and helps reduce false signals.
Example of a Strong Indicator Combo:
- RSI for momentum
- SuperTrend for trend direction
- Volume Profile for price acceptance zones
When all three align (Example:-, RSI bouncing off 30, SuperTrend is bullish, and price is above POC), you have got a high-probability trade setup.)
Other Powerful Combinations:
- MACD + OBV for volume-backed momentum
- Bollinger Bands + Stochastic RSI for volatility breakouts
- ADX + EMA for trend continuation confirmation
The trick is to avoid redundancy. Do not use five momentum indicators that all show the same thing. Instead, choose diverse tools that each provide unique insight.
Avoiding Analysis Paralysis
Too many indicators can lead to ‘analysis paralysis‘ when your screen is cluttered, and you second-guess every signal. It is one of the most common beginner mistakes on TradingView.
Tips to Avoid This Trap:
- Limit your setup to 2–3 core indicators.
- Use color coding and alerts to reduce screen time.
- Keep your charts clean and readable.
Remember, trading is about clarity. The best traders simplify, not complicate. You want your setup to help you act decisively, not freeze you with conflicting signals.
Mistakes Traders Make With Indicators
Overcomplicating the Chart
There is a joke in trading circles: “If your chart looks like a rainbow exploded, you are doing it wrong.” New traders often load up 10+ indicators thinking it will give them an edge. In reality, it usually leads to confusion and indecision.
Overcomplicating leads to:
- Signal conflicts
- Missed opportunities
- Slower reaction time
Each indicator should serve a purpose. If it doesn’t add unique value, ditch it. Less is often more when it comes to charts.
Relying on Indicators Without Strategy
Indicators are tools, not a substitute for trading knowledge or a well-thought-out strategy. Relying purely on signals like ‘RSI is overbought’ without understanding market context, price action, and risk management is a recipe for disaster.
The Right Approach:
- Use indicators to support your thesis, not create one.
- Pair with backtested strategies and clear rules.
- Always use stop-loss and take-profit levels.
In 2025, the most successful traders understand that discipline more than the tools. Your mindset, consistency, and ability to manage trades will always outweigh any indicator, no matter how advanced.
Creating Custom Indicators on TradingView
Pine Script Overview
Pine Script is TradingView’s native coding language. It allows traders to create their own custom indicators, strategies, and alerts. It is beginner friendly, with simple syntax and excellent documentation.
What You Can Build with Pine Script:
- Hybrid indicators combining RSI, MACD, and Bollinger Bands
- Custom buy and sell signal generators
- Backtestable strategies with logic and conditions
- Alert systems based on multiple timeframes
Learning Pine Script unlocks the true power of TradingView. You can start by forking existing scripts from the public library and tweaking them to fit your needs.
Using Public Libraries & Customizing
You don’t need to be a coder to take advantage of Pine Script. The Public Library is filled with open source indicators you can copy, edit, and customize. Want to add an alert? Change the colors? Modify a setting? It is all doable with just a few lines of code.
Popular Customization Ideas:
- Changing RSI levels from 70/30 to 80/20 for crypto
- Adding alerts when MACD crosses Signal line
- Visual tweaks for cleaner chart display
Custom indicators give you an edge by tailoring tools to your exact trading style. Plus, it is a lot of fun once you get the hang of it.
The Role of Indicators in Trading Success
Technical indicators are the compass of modern trading. They help identify trends, reversals, entry and exit points, and overall market strength.
In a world where price action is king, indicators act as powerful advisors. They are not infallible, but when used correctly, they add layers of clarity to your strategy.
Think of them like the instruments in a cockpit, no pilot flies blind. Similarly, no smart trader relies on gut feeling alone.
The best indicators do not just react to price, they reveal hidden patterns, help validate your bias, and alert you when to jump in or get out.
Still, indicators are tools, not magic bullets. Success comes from how you use them, paired with risk management, market knowledge, and emotional discipline.
Final Thoughts
Indicators Are Tools, Not Crystal Balls. TradingView indicators are incredible assets for any trader, but they are just tools. They won’t predict the future, and they won’t guarantee profits. The secret sauce is how you use them, with discipline, clarity, and consistency.
In 2025, TradingView offers more power than ever. Whether you are a scalper, swing trader, or long-term investor, the right indicators can drastically improve your edge.
Start simple, test often, and always keep learning. The market rewards those who adapt, and TradingView’s toolbox is ready to help you stay ahead.
So firends i hope you must liked these indicators.
Read: How to Trust Your Trading System: Strategy for Long-Term Success
FAQs
1. What are the best free TradingView indicators in 2025?
Some of the top-rated free indicators include QQE Mod, Auto Fib Retracement, Stochastic RSI, and Multi-Timeframe RSI. They offer strong utility without costing a dime.
2. Is LuxAlgo worth the subscription?
If you value streamlined signals, automatic trend detection, and don’t mind paying a premium, LuxAlgo is highly recommended for serious traders.
3. Can beginners use complex indicators like Market Cipher?
Yes, but expect a learning curve. Market Cipher has a steep setup process, so beginners should take time to study it or start with simpler tools first.
4. How many indicators should I use at once?
Stick to 2–3 max on your main chart. Use others in a secondary window if needed. Too many indicators can cloud your judgment.
5. Are TradingView indicators accurate?
Indicators are based on math, they are accurate in calculation, but how you interpret them in context determines their effectiveness.
Contents
- 1 Understanding Technical Indicators
- 2 My favourite Best TradingView Indicators
- 3 Built-in Best TradingView Indicators
- 4 Best Custom TradingView Indicators
- 5 Trend-Following Indicators
- 6 Momentum Indicators
- 7 Volume-Based Indicators
- 8 Volatility Indicators
- 9 Support and Resistance Indicators
- 10 Best Free Indicators on TradingView
- 11 Free vs Paid
- 12 How to Combine Indicators for Maximum Effectiveness
- 13 Mistakes Traders Make With Indicators
- 14 Creating Custom Indicators on TradingView
- 15 The Role of Indicators in Trading Success
- 16 Final Thoughts
- 17 FAQs