Mastering the CM_Ultimate RSI Multi Time Frame Tradingview Indicator
CM_Ultimate RSI Indicator
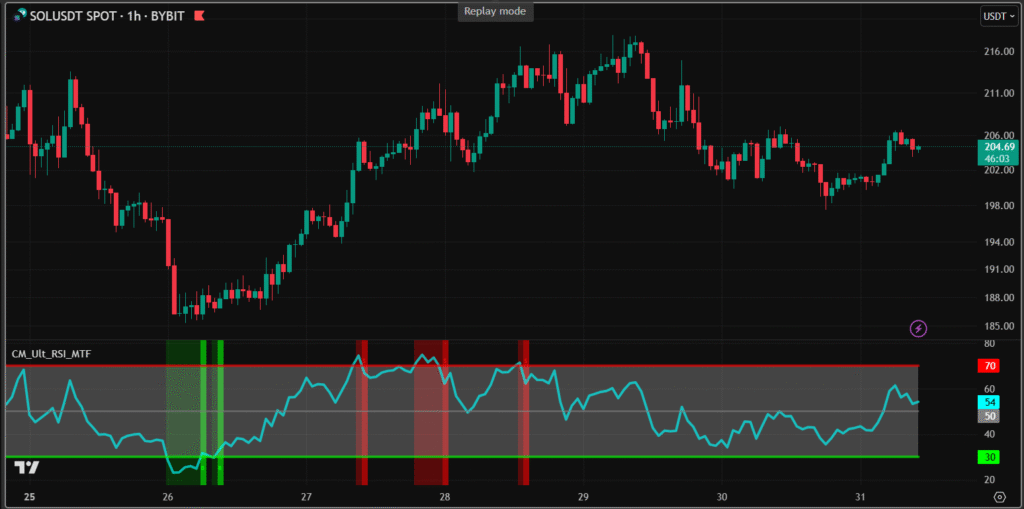
The CM_Ultimate RSI Multi Time Frame indicator is a sophisticated tool designed for traders using the TradingView platform.
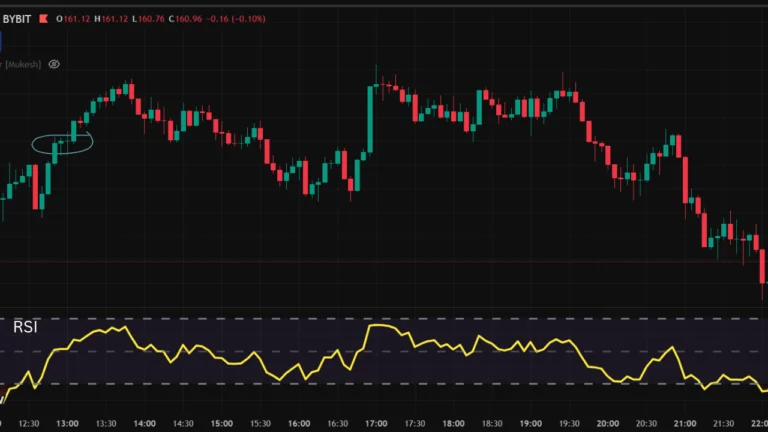
It builds on the traditional Relative Strength Index (RSI), which measures the speed and change of price movements to identify overbought (above 70) or oversold (below 30) conditions.
This indicator, however, allows analysis across multiple time frames, offering a broader market perspective. Created by ChrisMoody, it has gained significant traction, with over 299,614 likes/views, making it a top choice for 2025 trading strategies.
Best RSI Settings for Day Trading: A Comprehensive Guide
Setting Up and Using the Indicator
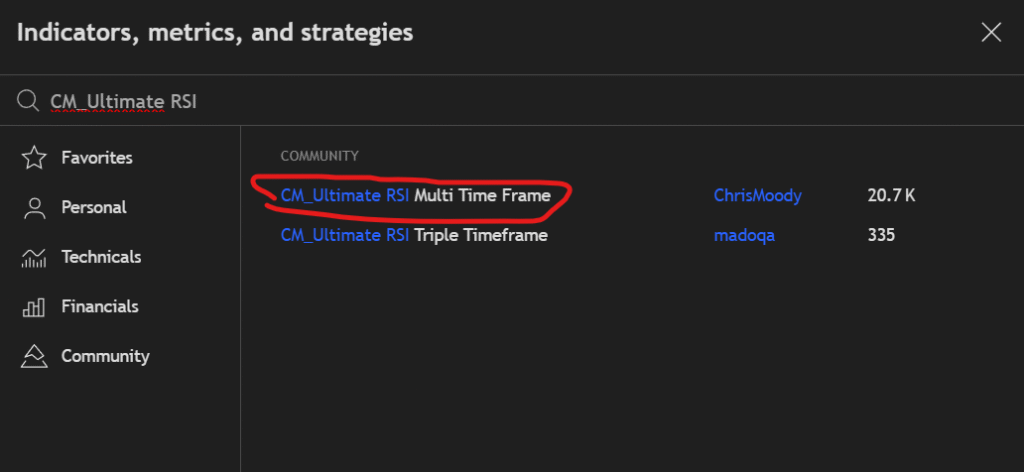
To use this indicator, log into TradingView, add it via the “Indicators” search, and configure settings like time frames for the first and second RSI, background highlights, and buy and sell signals.
It is versatile for intraday, swing, or position trading, with options to tailor it to your strategy. For example, you might set the first RSI to a 1-hour chart and the second to a 4-hour chart for trend confirmation.
Practical Applications
This indicator is useful for:
- Trend Following: Confirming uptrends by checking RSI above 50 on higher time frames during pullbacks.
- Mean Reversion: Spotting overbought and oversold conditions for potential reversals, like shorting when daily RSI hits 80 in a range.
- Breakout Confirmation: Validating breakouts with RSI momentum across time frames, ensuring higher time frame RSI isn’t overbought.
Backtesting related RSI strategies, like ChrisMoody’s CM RSI-2, shows strong performance, suggesting this indicator could be effective with proper testing. However, results depend on market conditions and trader expertise.
Combining with Other Tools
Research suggests combining it with moving averages for trend confirmation, MACD for momentum, or Bollinger Bands for volatility.
For instance, a bullish MACD crossover with RSI above 50 on multiple time frames could signal a strong buy. This approach can enhance reliability but requires experimentation.
Survey Note: Detailed Analysis of the CM_Ultimate RSI Multi Time Frame Indicator on TradingView
In the dynamic trading environment of 2025, technical indicators play a crucial role in helping traders navigate volatile markets.
The CM_Ultimate RSI Multi Time Frame indicator, developed by ChrisMoody and available on TradingView, has emerged as a leading tool for its ability to analyze the Relative Strength Index (RSI) across multiple time frames.
This survey note, written at 05:36 PM PDT on Sunday, August 03, 2025, provides a comprehensive exploration of its features, usage, and practical applications, aiming to equip traders with the knowledge to leverage this indicator effectively.
The RSI, a momentum oscillator developed by J. Welles Wilder, traditionally measures the speed and change of price movements, with values above 70 indicating overbought conditions and below 30 suggesting oversold conditions.
The standard RSI, however, is limited to a single time frame, which can miss broader market trends. The CM_Ultimate RSI Multi Time Frame addresses this by allowing traders to view RSI values from different time frames on the same chart, enhancing decision-making.
Given its popularity, with over 299,614 likes/views on TradingView, and its ranking as the top indicator for 2025 in recent analyses, it is timely to examine its utility.
The RSI Indicator in Crypto: Overbought Oversold Indicator Explained
Methodology and Sources
This analysis is based on information gathered from TradingView’s indicator page, community discussions, and related articles.
Key sources include the indicator’s official description, Forex Factory threads on similar multi-time frame RSI tools, and backtesting results for related indicators like CM RSI-2 Strategy. The focus is on synthesizing these details to provide a thorough understanding, acknowledging the complexity and potential variability in trading outcomes.
Detailed Features and Functionality
The CM_Ultimate RSI Multi Time Frame indicator offers a range of customizable features, as outlined in Table 1 below, which enhance its utility for traders:
| Feature | Description |
|---|---|
| RSI Time Frame Flexibility | Allows changing the first RSI to a different time frame (defaults to current chart). |
| Background Highlighting | Highlights chart background when first RSI is above 70 or below 30 (overbought/oversold). |
| Background Highlighting for Crosses | Highlights when first RSI crosses above 30 or below 70, aiding entry/exit identification. |
| Buy/Sell Signals | Displays “B” for buy (RSI > 30) and “S” for sell (RSI < 70), customizable. |
| Mid-Line Plot | Option to plot mid-line (typically 50) for neutral condition analysis. |
| Second RSI Plot | Plots a second RSI from a different time frame for comparative analysis. |
| Look Back Period for 2nd RSI | Allows setting a different look back period (e.g., 14, 21) for the second RSI. |
These features, detailed on the TradingView page CM_Ultimate RSI Multi Time Frame Indicator, enable traders to tailor the indicator to their strategies, whether for intraday, swing, or position trading. For instance, a trader might set the first RSI to a 5-minute chart for short-term signals and the second to a 1-hour chart for trend confirmation.
Setting Up and Configuration
To implement this indicator, traders must first access TradingView, log in, and navigate to their desired chart. The process involves:
- Clicking the “Indicators” button and searching for “CM_Ultimate RSI Multi Time Frame.”
- Adding it to the chart and accessing the settings panel to configure parameters such as time frames, background highlights, and buy/sell signals.
- Enabling the second RSI if needed, selecting its time frame, and adjusting the look back period.
This setup, as discussed in community forums like Forex Factory, allows for flexibility, with traders able to experiment with settings based on market conditions. For example, a day trader might use 5-minute and 15-minute RSIs, while a swing trader might prefer daily and weekly views.
Practical Applications and Case Studies
The indicator’s versatility is evident in its application across various trading strategies. Below are detailed examples, supported by hypothetical scenarios:
- Trend Following Strategy:
- Scenario: Trading EUR/USD on a 1-hour chart, with a multi-day uptrend.
- Setup: First RSI on 1-hour, second RSI on 4-hour.
- Observation: 1-hour RSI at 65 (bullish), 4-hour RSI at 75 (overbought but trending).
- Action: Wait for a pullback where 1-hour RSI dips below 50 but stays above 30, with 4-hour RSI above 50, indicating a strong uptrend for a long entry.
- This approach leverages the indicator’s ability to confirm trend strength across time frames, as noted in discussions on multi-time frame analysis Forex Multiple Time Frame Analysis.
- Mean Reversion Strategy:
- Scenario: S&P 500 ranging between 4000 and 4200 on a daily chart.
- Setup: First RSI on daily, second RSI on weekly.
- Observation: Daily RSI at 80 (overbought), weekly RSI at 60 (neutral).
- Action: Short position targeting 4000, with a stop-loss above 4200, expecting a mean reversion.
- This strategy benefits from the indicator’s ability to identify overbought/oversold conditions, aligning with RSI trading strategies RSI Trading Strategy.
- Breakout Confirmation:
- Scenario: Stock breaks above $55 resistance on high volume.
- Setup: Check RSI on 1-hour, 4-hour, and daily charts.
- Observation: 1-hour RSI at 60, 4-hour at 70, daily at 55 (not overbought).
- Action: Long position with stop-loss below $55, targeting previous range extension, validated by multi-time frame momentum.
- This use case highlights the indicator’s role in confirming breakouts, reducing false signals.
Backtesting Insights
While specific backtesting results for the CM_Ultimate RSI Multi Time Frame are not available, insights from related indicators provide context. The CM RSI-2 Strategy, another ChrisMoody creation, showed impressive results:
- Tested on S&P 100 in down-trending, up-trending, and combined markets, outperforming general averages.
- For forex, tested on 12 major pairs over 5 years and 80 pairs from 2007 to 2014, with an average trade length of just over 2 days, “crushing” market averages.
- These results, detailed on CM RSI-2 Strategy Page, suggest that RSI-based multi-time frame strategies can be effective, encouraging traders to conduct their own backtesting for this indicator.
Advantages and Limitations
The indicator offers several advantages:
- Comprehensive Analysis: Multi-time frame RSI provides a holistic view, capturing both short-term and long-term trends.
- Customizability: With options like background highlights and second RSI, it caters to diverse trading styles.
- Visual Cues: Buy/sell signals and highlights simplify spotting opportunities, as noted in community feedback Reddit RSI Discussions.
However, limitations include:
- Complexity: Beginners may find multi-time frame analysis challenging, requiring time to master.
- False Signals: In ranging markets, it may generate false signals, necessitating confirmation with other indicators.
- Time Frame Dependency: Effectiveness depends on chosen time frames, which may require experimentation, as discussed in Multi-Timeframe RSI Panel.
Combining with Other Indicators
Research suggests combining the CM_Ultimate RSI Multi Time Frame with other tools for enhanced reliability:
- Moving Averages: Confirm trends, e.g., price above 200-day MA with RSI above 50.
- MACD: Use crossovers for momentum, as seen in CM_MacD_Ult_MTF Analysis.
- Bollinger Bands: Identify volatility, with RSI confirming overbought/oversold at band extremes.
- Volume Indicators: Confirm signal strength with volume spikes, enhancing breakout validity.
- Fibonacci Retracement: Combine with RSI for support/resistance, improving entry/exit precision.
These combinations, as explored in trading communities, can create robust strategies, though outcomes vary by market and trader expertise.
Conclusion and Recommendations
The CM_Ultimate RSI Multi Time Frame indicator is a powerful tool for traders seeking to enhance their technical analysis in 2025.
Its ability to provide multi-time frame RSI insights makes it suitable for trend following, mean reversion, and breakout confirmation, with potential for customization and combination with other indicators.
However, traders must acknowledge its complexity and potential for false signals, emphasizing the need for backtesting and risk management.
For optimal use, experiment with settings, integrate with other tools, and continuously refine strategies based on market conditions. As trading evolves, mastering such indicators will be crucial for navigating the complexities of financial markets, positioning traders for success in the dynamic landscape of 2025 and beyond.
What is the difference between standard RSI and multi-time frame RSI?
Standard RSI is calculated on a single time frame, while multi-time frame RSI, like this indicator, allows viewing RSI across multiple time frames for a broader analysis, as detailed on TradingView RSI Overview.
Can I use this indicator for intraday trading?
Yes, it is suitable for intraday trading by selecting time frames like 5-minute, 15-minute, and 1-hour, aligning with day trading strategies discussed in Forex Factory RSI MTF.
Is there a way to automate trading based on this indicator?
TradingView supports alerts and Pine Script for partial automation, but fully automated trading requires integration with platforms supporting algorithmic trading, as noted in community discussions.
How often should I adjust the settings of the indicator?
Adjust settings based on strategy and market conditions, with periodic optimization recommended, as suggested in RSI Trading Strategy.
Where can I learn more about ChrisMoody’s indicators?
ChrisMoody’s indicators are available on TradingView, with comments and tutorials often found on his profile, enhancing community learning, as seen in ChrisMoody Indicators.
Read: Crypto Market Timings in India: A Comprehensive Guide for Investors
Contents
- 1 CM_Ultimate RSI Indicator
- 2 Setting Up and Using the Indicator
- 3 Practical Applications
- 4 Combining with Other Tools
- 5 Survey Note: Detailed Analysis of the CM_Ultimate RSI Multi Time Frame Indicator on TradingView
- 6 Conclusion and Recommendations
- 6.1 What is the difference between standard RSI and multi-time frame RSI?
- 6.2 Can I use this indicator for intraday trading?
- 6.3 Is there a way to automate trading based on this indicator?
- 6.4 How often should I adjust the settings of the indicator?
- 6.5 Where can I learn more about ChrisMoody’s indicators?