Best 5 Crypto Day Trading Strategies 2025

If you’re diving into crypto day trading in 2025, having the right strategy is more important than ever. The market’s moving fast, with more volatility, smarter AI tools, and constantly changing regulations, it’s easy to fall behind if you’re not paying attention.
That’s why I put together this guide, to help you stay ahead of the game. We’ll walk through the most up-to-date and effective strategies for crypto day trading this year.
You’ll learn how to use technical analysis, make the most of trading bots, manage your risk like a pro, and take advantage of short-term price swings in today’s fast-moving digital market.
Crypto Day Trading Strategies 2025
These strategies for modern traders who started trading in 2025. Here is all advance trading strategies, you need basic complete knowledge of trading to understand this strategies.
1. AI Liquidity Zones Strategy
What Are AI Liquidity Zones?
AI liquidity zones are the modern trader’s GPS. In a market as volatile as crypto, liquidity is everything.
It defines where prices are most likely to pause, reverse, or break out with volume. Liquidity zones are areas where large amounts of buying or selling interest congregate—think of them like magnetic fields on your price chart.
You can use LiquidationHeatMap to know where is liquidity.
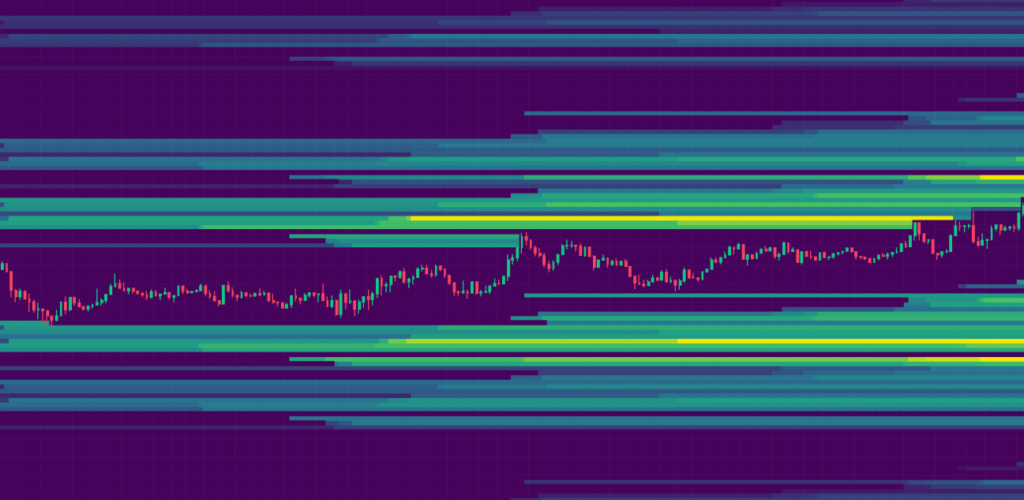
Now, AI steps in to analyze massive datasets, from order books to historical volume clusters, and identifies these zones with incredible precision.
Rather than manually drawing support and resistance levels, traders now use AI tools that automatically scan multiple exchanges, timeframes, and even cross-chain liquidity to highlight the most relevant price zones.
What makes these zones so valuable is their predictive power. When price enters a liquidity zone, the probability of a reaction increases significantly. Whether it’s a bounce, consolidation, or sharp breakout, traders can anticipate movement and set their trades accordingly.
How AI Identifies Key Trading Zones
AI algorithms are trained to identify key characteristics of high-liquidity zones using machine learning models. These include:
- Price points with repeated volume spikes
- Aggressive bid/ask clustering in order books
- High-frequency transaction density
- Reversion patterns from prior liquidity hits
The AI continuously feeds on this data, refining its zone detection to adjust dynamically as the market evolves. This is especially useful in crypto, where sentiment and volume can shift drastically within minutes.
For example, if Bitcoin is approaching a historically heavy sell zone but the order book shows disappearing ask liquidity, that’s a cue for a potential breakout. AI helps traders catch these shifts before the human eye can even recognize the setup.
Using Liquidity Zones to Optimize Entry and Exit
One of the toughest parts of trading is getting your timing right. If you jump in too early, you risk getting stopped out. Wait too long, and the opportunity’s already passed. That’s where liquidity zones come in, they give you a reliable way to spot high-probability entry and exit points, so you’re not just guessing when to get in or out.
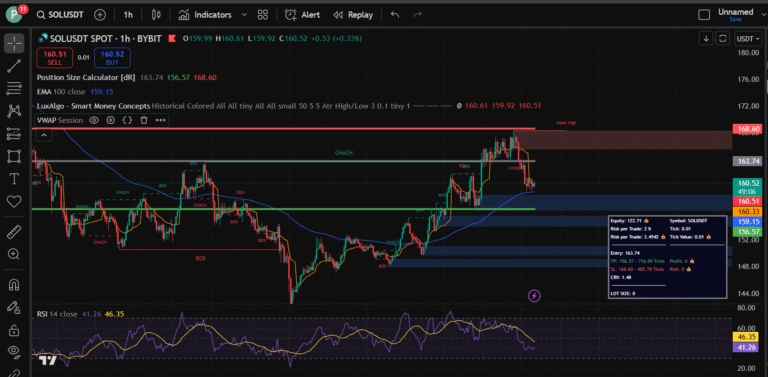
You can find liquidity levels or area with tradingview indicater or with Liquidation Heatmap.
- Entry Zones: When price approaches a buy-side liquidity pool and stalls with bullish confirmation, it’s a green light for entry.
- Exit Zones: Conversely, when price hits a known sell-side liquidity area, smart traders start trimming profits or setting trailing stops.
You can even layer this strategy with Fibonacci levels or trendline confluence for more confidence. But the real magic happens when liquidity zones act as both magnet and mirror, they attract price and reflect momentum shifts.
Risk Management within Liquidity Zones
Trading around liquidity zones doesn’t mean going all-in. In fact, these areas require disciplined risk management. Volatility can spike as price reacts to these zones, triggering false breakouts or fakeouts designed to trap retail traders.
- Use tighter stop-losses when entering near zone edges
- Set alerts for volume spikes or rapid order book changes
- Avoid trading into low-volume hours where liquidity thins out
Smart traders use partial positions, scaling in near the middle of a liquidity zone and setting exits near the top or bottom edge. This way, you’re riding the wave rather than getting crushed by it.
2. On-Chain Sentiment Pulse
Understanding On-Chain Sentiment Analysis
Let’s talk emotions, but not just your gut feelings. On-chain sentiment pulse is all about capturing the real emotional and behavioral cues of the crypto market using blockchain data.
In 2025, traders no longer rely solely on social media chatter or news headlines. They want raw, unfiltered data, and the blockchain delivers exactly that.
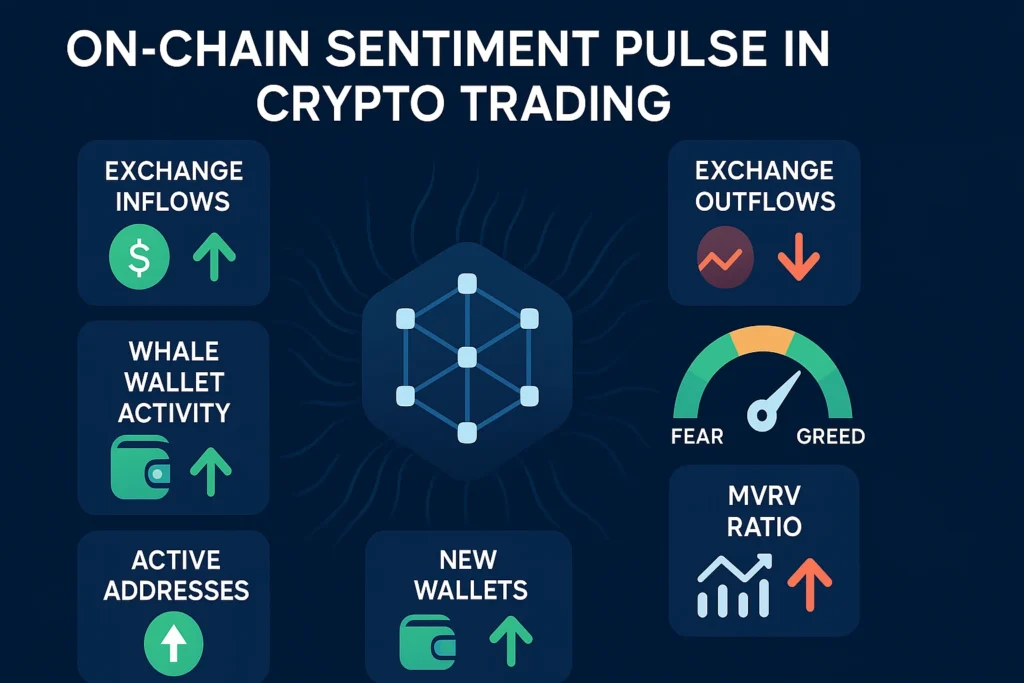
On-chain sentiment analysis involves tracking various metrics directly from the blockchain to understand what the market is feeling.
Are wallets accumulating or dumping? Are smart contracts being deployed at scale? Is there a sudden spike in stablecoin inflows into exchanges? All these are breadcrumbs leading to one thing: market sentiment.
Unlike traditional sentiment analysis, which might rely on natural language processing (like scraping Twitter), on-chain data is immune to manipulation. You’re not just guessing how the crowd feels, you’re watching them act with their wallets. That’s a game-changer.
Popular sentiment metrics include:
- Net inflows/outflows to exchanges
- Wallet holding duration (HODL behavior)
- Smart contract interaction frequency
- Token age consumed (recycled coins)
- Gas fee spikes (suggesting urgency or panic)
By analyzing these, traders can spot bullish accumulation phases or fear-driven sell-offs before prices reflect them. It’s like being able to smell smoke before the fire starts.
Tracking Wallet Movements and Smart Contract Activity
Blockchain transparency means everything is traceable. And in the hands of a savvy trader, tracking wallet movements can be pure gold. Here’s why.
Imagine seeing a multi-million-dollar wallet, known to belong to a DeFi fund, suddenly start moving ETH to an exchange. That’s a red flag. Or perhaps you notice several smaller wallets consolidating assets and sending them to cold storage, that’s usually bullish.
By monitoring whales, top-performing addresses, or even newly activated wallets, you get a pulse on what’s really happening beneath the surface. And it’s not just about Bitcoin or Ethereum. On-chain tools in 2025 track data across L2s, sidechains, and even newer ecosystems like Sui or Aptos.
Smart contract activity is another gem. If a lending protocol suddenly sees a surge in deposits, that might signal traders gearing up for a big play. Or maybe there’s an NFT mint spike, that could shift capital flows. On-chain sentiment gives you foresight, not just hindsight.
Tools like Nansen, Arkham Intelligence, and Dune Analytics have made it easier than ever to visualize and analyze this data. You don’t need to be a developer- just a smart trader who knows what to look for.
Predictive Value of On-Chain Metrics
Here’s the kicker: on-chain sentiment isn’t just informative, it’s predictive.
In many cases, on-chain activity precedes price action. For instance, a sharp uptick in USDC inflows into centralized exchanges usually means more buying power is about to hit the market. Conversely, a surge in BTC outflows to cold storage often signals long-term bullish sentiment, as holders are choosing safety over trading.
Another big one is token age consumed. If old coins (dormant for years) suddenly move, it could suggest panic selling, or whale repositioning. These subtle cues, when combined, offer a predictive map of market psychology.
Predictive analysis can also help filter out fake pump-and-dump schemes. You’ll notice when hype isn’t supported by actual blockchain activity. If a token is trending on X.com, but has no on-chain volume growth, that’s a red flag.
Pair these signals with technical setups, and you’ve got a powerful hybrid approach, part data scientist, part chartist.
Integrating Sentiment Pulse with Technical Indicators
On-chain data doesn’t replace technical indicators, it enhances them. Think of it as X-ray vision for your chart setups.
Let’s say your technicals show a bullish wedge forming. Great. But what if on-chain sentiment shows whale accumulation and shrinking supply on exchanges? That’s confirmation. Now your setup has a data backbone.
Some smart ways to integrate both worlds:
- Use exchange inflow/outflow metrics to confirm support or resistance zones
- Match wallet behavior with volume spikes on your chart
- Align smart contract activity with breakout setups
- Layer token age and supply metrics onto price divergence
When you bring together real blockchain behavior and technical price action, your edge increases dramatically. You’re not just guessing, you’re trading with insight that few others have.
3. Microstructure Entry Logic (Precision Timing)
What is Market Microstructure in Crypto?
Market microstructure refers to the nitty-gritty mechanics of how trades are executed, orders are matched, and prices are formed, essentially the plumbing of the market. While this concept has long been used in traditional finance, crypto traders in 2025 are finally waking up to its power.
In crypto day trading, microstructure gives you a split-second view of what’s actually happening in the order book. It helps you answer critical questions like:
- Who’s buying and selling right now?
- Are large limit orders real or spoofed?
- Is there hidden liquidity waiting to get triggered?
By studying these granular details, traders can time entries and exits with almost surgical precision. You’re no longer just reacting, you’re anticipating.
Tools for High-Precision Entry
To trade microstructure effectively, you need tools that go beyond TradingView. In 2025, these tools are more accessible than ever:
- Order Flow Visualizers: Tools like Exocharts or Bookmap show real-time heatmaps of bid/ask liquidity.
- Footprint Charts: Visualize how much volume is transacted at each price level.
- Delta and Imbalance Indicators: Show the difference between market buys and sells.
- Volume Profile + VWAP: For intraday mean reversion setups.
These tools help you see where real interest lies, often where price has reacted multiple times with high volume, or where big players are stacking orders.
It’s like reading the market’s fingerprints. You’re watching where money is flowing, not just where price is moving.
Latency Arbitrage and Order Book Analysis
Latency arbitrage is where milliseconds matter. While this is more common in high-frequency trading firms, the principle is still valuable for day traders. By monitoring how fast liquidity moves between different exchanges, you can sometimes exploit pricing inefficiencies.
For example, if BTC is trading at $66,200 on Binance and $66,180 on Coinbase, fast traders can buy on one and sell on the other for a quick spread, especially during news events when price dislocations are common.
Order book analysis also helps you avoid traps. Spoofing, where a trader places large orders to create false demand and then removes them, is still alive and well. Microstructure tools can flag these ghost orders, helping you avoid getting baited.
Scalping with Microstructure Insight
Microstructure strategies are perfect for scalping, those rapid in-and-out trades that last minutes or even seconds.
Here’s how a typical microstructure scalp setup looks:
- Identify a liquidity cluster with heavy bid support.
- Wait for a market sell-off into that cluster.
- Watch for a volume absorption or bullish delta flip.
- Enter with tight risk, exit on mean reversion.
The edge lies in reading what the market is about to do, not just what it’s done.
When paired with other strategies like AI Liquidity Zones or On-Chain Sentiment, microstructure scalping becomes even deadlier. It’s fast, precise, and surprisingly low-risk when done right.
4. Smart Flow Bounce Strategy
Flow-Based Trading Overview
Flow-based trading is all about following the money. In 2025, crypto traders increasingly rely on identifying where smart money is going, whether it’s big institutions, experienced whales, or fast-moving arbitrage bots. The idea is simple: price follows flow.
The Smart Flow Bounce Strategy is a technique that uses this flow data to spot high-probability bounce zones. Instead of reacting to price moves, you anticipate them by reading real-time fund flows, transaction sizes, and liquidity movements. It’s like surfing, you don’t fight the wave, you ride it.
What makes this strategy unique is that it focuses on intent rather than just impact. By analyzing smart contract data, DEX transactions, and layer-2 movement, traders can tell when capital is entering or exiting specific zones with purpose.
Here’s what this might look like:
- Big inflows of stablecoins (like USDT or USDC) into exchanges often precede a buying wave.
- Rapid bridging from Ethereum to Arbitrum may signal altcoin positioning.
- A surge in Wrapped ETH being unwrapped could mean traders are preparing to sell ETH on spot.
By monitoring this smart flow, you can find areas where price is likely to bounce or reverse, giving you precise entry points.
Identifying “Bounce Zones” with Smart Flow
Bounce zones are essentially areas where aggressive flows meet strong liquidity. They’re usually found near previous highs/lows, demand/supply zones, or areas of confluence like Fibonacci retracements and moving averages.
The key to identifying them is to match price action with smart money behavior.
Let’s break it down:
- Watch Wallets and Exchanges: If wallets start depositing stablecoins into Binance or Coinbase, it’s a strong sign that they’re getting ready to buy.
- DEX Transaction Surge: Look for sudden volume spikes in tokens like ETH, SOL, or AVAX on Uniswap or other DEXs.
- On-Chain Routing Data: Use tools like DeBank or Zerion to see routing patterns—where funds are going, and which pools they’re targeting.
- Liquidity Pool Additions/Removals: Watch for changes in Uniswap V3 ranges—if LPs are pulling out liquidity, a big move might be incoming.
Bounce zones are high-odds areas for trades—but only if backed by clear flow confirmation. You’re not just guessing that price might bounce at a trendline; you’re seeing money literally move into position before it happens.
Key Indicators for Flow Bounce Setups
To pull off the Smart Flow Bounce Strategy effectively, you need the right indicators. Here are the best ones used in 2025:
- Token Inflow/Outflow Charts (e.g., from Nansen or Glassnode)
- Exchange Net Transfer Volume
- Stablecoin Ratio (Market Cap vs. Exchange Balances)
- DEX Swap Volume by Pair
- TVL Spikes in DeFi Protocols
Let’s say you see a sharp increase in USDC transfers to exchanges and a simultaneous drop in BTC dominance. That often means traders are preparing to rotate into altcoins. If price pulls back to a known support zone during this flow pattern, it’s a prime bounce setup.
Add in order book confluence, on-chain sentiment, and maybe even microstructure signals, and you’ve got yourself a sniper-grade entry.
Timing here is everything. Smart flow usually leads the move, but it’s your job to wait for confirmation, never assume.
Backtesting the Strategy for Reliability
Backtesting is essential for any serious trading method. With the Smart Flow Bounce Strategy, the goal is to review historical periods where major price reversals were preceded by distinct smart flow signals.
Here’s how to backtest this approach:
- Select a Timeframe – Daily or 4-hour works well for macro setups; 15-min for scalping.
- Get Historical Flow Data – Use tools like Token Terminal, Dune Analytics dashboards, or even scrape your own using Flipside Crypto.
- Mark Bounce Zones – Look for areas where price stalled or reversed.
- Match with Flow – Was there smart money movement into that zone before the bounce?
- Score Accuracy – Note how often the bounce succeeded and what kind of risk/reward ratio it delivered.
In 2025, many automated systems already backtest these conditions using custom scripts or even AI bots. But even if you’re doing it manually, a few hours of focused review can boost your confidence massively.
The bottom line? Don’t just trust the chart, trust the flow.
5. Whale Trap Sniper Method
Recognizing Whale Trap Patterns
The crypto markets may be decentralized, but they’re not immune to manipulation. Whales—wallets holding large amounts of a cryptocurrency, still play mind games. That’s where the Whale Trap Sniper Method comes in.
It’s all about identifying price zones where whales intentionally bait retail traders, only to reverse the move for maximum liquidity capture.
A classic whale trap looks like this:
- Fake Breakout: Price breaks above a key resistance with big volume. Everyone jumps in long.
- Sudden Reversal: Price tanks just after entry, stopping out late buyers.
- Whale Accumulation: Whales buy back at lower prices, having exited near the fake top.
This method aims to spot the trap before you fall into it. And the signs are usually visible, if you know what to look for.
Key signs of a whale trap include:
- Disproportionately high volume candles near resistance/support
- No follow-through after breakout or breakdown
- Large open interest spikes followed by mass liquidations
- Order book spoofing (fake walls suddenly pulled)
Once identified, this creates a sniper opportunity, entering just after the trap has sprung, riding the real move while others are licking their wounds.
Timing the Sniper Entry
The key to executing the Whale Trap Sniper Method is patience. You’re not trying to catch the first breakout, you’re waiting for the failure, the pain, and then stepping in when the risk-reward flips in your favor.
Here’s a typical process:
- Identify the Trap Zone: Look for a liquidity zone where breakouts have repeatedly failed.
- Wait for the Fakeout: Let price push through the level with high volume.
- Watch for Rejection: Confirm with bearish divergence, wicks, or order book flips.
- Enter on Breakdown: Use tight stops just above the trap wick.
- Target the Opposite Liquidity Pool: That’s where the move is headed.
This strategy often lines up with liquidation zones. When price triggers a trap, it usually also triggers stop-loss orders and liquidates leveraged traders. You’re stepping in with precision while the crowd exits in panic.
Stop-Loss and Take-Profit Mechanics
Risk management is crucial in whale trap setups because the volatility is intense. You’re trading into chaos, but with an edge.
Stop-Loss Placement:
- Just above the trap wick (if shorting after a fake breakout)
- Just below the fake breakdown low (if longing the reversal)
Take-Profit Ideas:
- Nearest support/resistance zone
- VWAP or equilibrium price
- Fibonacci retracement levels
Always consider using a trailing stop after the first TP zone hits. Traps often lead to violent moves- ride them as far as they go, but protect your gains.
Tracking Large Wallet Movements
The final piece of this strategy is tracking whales in real time. You can’t execute a whale trap strategy without knowing where the whales are playing.
Use platforms like:
- Arkham Intelligence – Assign wallet identities and track movements
- Whalemap – Visualize whale clusters and price memory
- Lookonchain or SpotOnChain – Daily breakdowns of top wallet trades
These tools show you where big wallets are buying, selling, or even attempting to bait retail liquidity. Match their behavior with your technical and flow setups, and you’ve got a sniper rifle instead of a slingshot.
Final Thoughts on Day Trading Tactics
If you’re day trading crypto in 2025 and still using outdated strategies, you’re already behind. The game has changed. The days of drawing lines on a chart and waiting for a golden crossover are fading fast. Now, it’s about data precision, predictive analytics, and real-time decision-making.
Each of the five strategies we’ve explored- AI Liquidity Zones, On-Chain Sentiment Pulse, Microstructure Entry Logic, Smart Flow Bounce, and Whale Trap Sniper Method, offers a unique edge that addresses different market conditions. Some work best in low volatility, others thrive during news-driven chaos. But together, they form a comprehensive toolkit that can elevate your trading approach to elite status.
Here’s the key takeaway: the best traders in 2025 don’t just react, they anticipate. They use AI to map liquidity traps, monitor whale wallets before they dump, and spot flow shifts that scream “incoming reversal.” These aren’t just nice-to-haves anymore, they’re the new standard.
Success in crypto trading is about stacking edges. Use AI liquidity tools to find where price wants to go. Use on-chain sentiment to confirm whether the crowd is panicking or confident. Use microstructure to pinpoint your entry down to the second. Use smart flow to find bounce zones where you can snipe the bottom. And use whale trap logic to make sure you’re not the liquidity, they are.
It’s not about having a million indicators. It’s about mastering the right tools and knowing how and when to apply each one. Consistency comes from process, not luck. So backtest, document, and refine your edge.
And above all- stay adaptable. Crypto is evolving fast. What works today may need tuning tomorrow. But armed with these strategies, you’ll always be one step ahead of the herd.
I hope you must liked these best 5 crypto day trading strategies.
FAQs
1. What’s the best crypto trading strategy for beginners in 2025?
For beginners, AI Liquidity Zones are a great start. They’re visual, easy to understand, and offer clear entry/exit points. Pair this with basic risk management, and you’ve got a strategy that reduces guesswork and emotion.
2. Is on-chain analysis more reliable than technical analysis?
Not more reliable, but more real. On-chain shows what traders are doing while technicals show what price has done. The sweet spot is using both together. On-chain sentiment can confirm or invalidate your chart setups.
3. How risky is the Whale Trap Sniper Method?
The zones themselves represent real market interest. While spoofing and fake orders can occur, modern AI models adjust dynamically and filter out many false signals. It’s still wise to confirm zones with volume, sentiment, or microstructure data.