Mastering the MACD Indicator How To Use
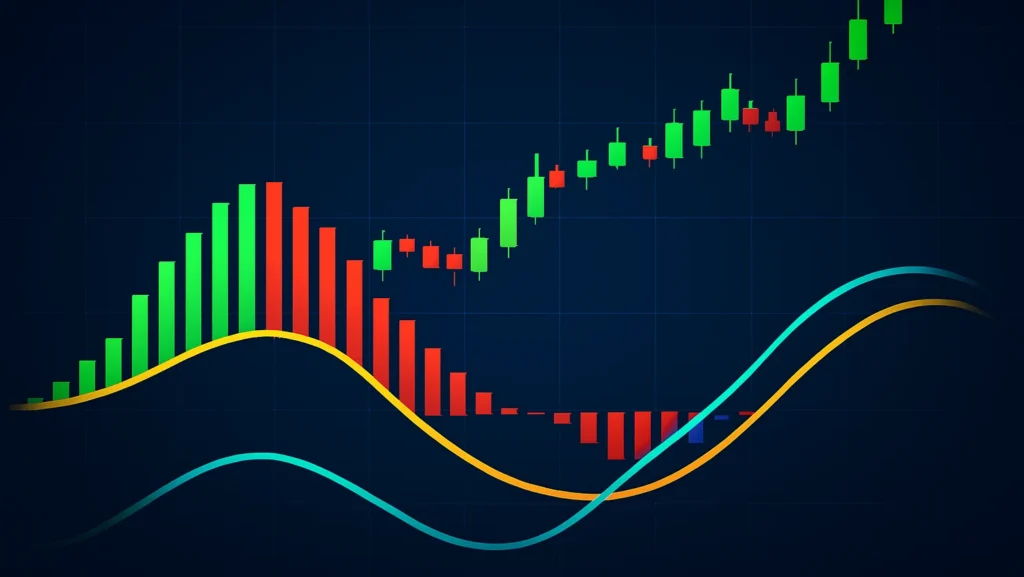
MACD Indicator Explained
In the fast-paced world of trading, having the right tools can make all the difference between a winning strategy and a costly mistake.
One such powerhouse is the Moving Average Convergence Divergence (MACD) indicator, a favorite among traders on platforms like TradingView.
If you are looking to enhance your technical analysis skills, understanding MACD can provide valuable insights into market momentum and potential trend reversals.
This guide dives deep into everything you need to know about the MACD indicator on TradingView.
Whether you are a beginner dipping your toes into forex, stocks, or crypto trading, or an experienced trader refining your approach, we will cover the basics, setup, interpretation, strategies, and more. By the end, you will be equipped to integrate MACD into your trading routine with confidence.
What is the MACD Indicator?
The MACD indicator, short for Moving Average Convergence Divergence, is a trend-following momentum tool developed by Gerald Appel in the late 1970s. It is designed to reveal changes in the strength, direction, momentum, and duration of a trend in a stock’s price.
At its core, MACD helps traders identify buying and selling opportunities by showing the relationship between two moving averages of a security’s price. On TradingView, it is one of the most accessible indicators, built right into the platform’s library.
Why is MACD so popular? It combines elements of trend and momentum analysis, making it versatile for various markets. Traders use it to spot potential entry and exit points, reducing the guesswork in volatile environments.
Key Components of the MACD Indicator
Breaking down MACD, you will find three main elements: the MACD line, the signal line, and the histogram. Each plays a crucial role in interpreting signals.
The MACD line is the difference between a 12-period Exponential Moving Average (EMA) and a 26-period EMA. This line oscillates above and below a zero line, indicating bullish or bearish momentum.
Next is the signal line, typically a 9-period EMA of the MACD line itself. It acts as a trigger for buy or sell signals when it crosses the MACD line.
Finally, the histogram represents the difference between the MACD line and the signal line. Bars above the zero line suggest bullish momentum, while those below indicate bearish trends.
On TradingView, these components are visually represented in a sub-chart below your main price graph, making it easy to read at a glance.
Read: Best RSI Settings for Day Trading: A Comprehensive Guide
How is MACD Calculated?
Understanding the math behind MACD can demystify its signals. The formula starts with calculating the two EMAs: short-term (usually 12 periods) and long-term (26 periods).
MACD Line = 12-period EMA – 26-period EMA
Signal Line = 9-period EMA of the MACD Line
Histogram = MACD Line – Signal Line
TradingView handles these calculations automatically, so you don’t need to crunch numbers manually. However, tweaking these periods can customize the indicator for different timeframes, like day trading versus long-term investing.
For instance, in fast-moving markets like cryptocurrencies, traders might shorten the periods to 5, 13, and 8 for quicker signals. This flexibility is one of TradingView’s strengths, allowing real-time adjustments without external software.
Setting Up MACD on TradingView
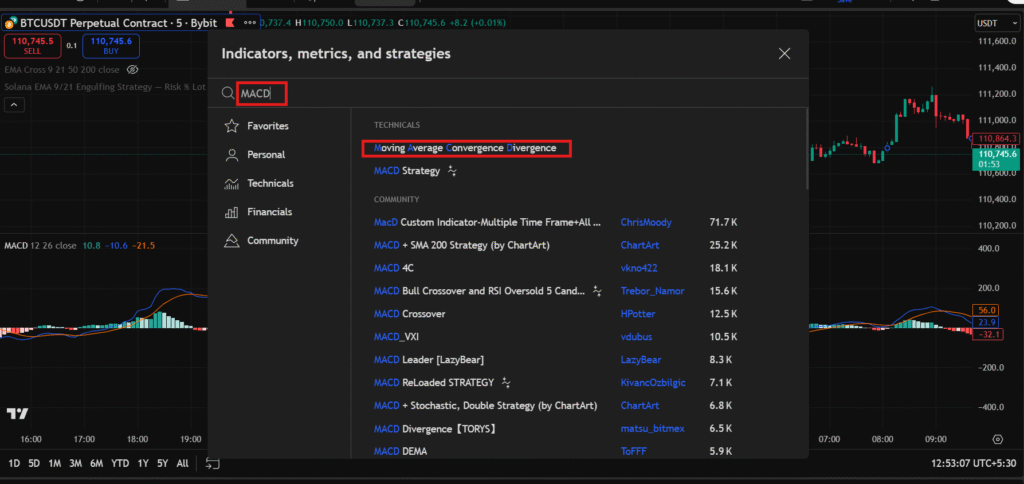
Getting started with MACD on TradingView is straightforward, even for newcomers. The platform’s user-friendly interface makes it simple to add and configure indicators.
First, log into your TradingView account and open a chart for your chosen asset, such as Bitcoin or Apple stock. Click on the “Indicators” button at the top of the chart.
Search for “MACD” in the search bar. You’ll see it listed under built-in indicators. Select it, and it will appear below your price chart.
TradingView also offers community scripts for modified MACD versions, like MACD with RSI or colored histograms for better visibility. Explore these in the public library for enhanced features.
Customizing Best MACD Settings for Your Strategy
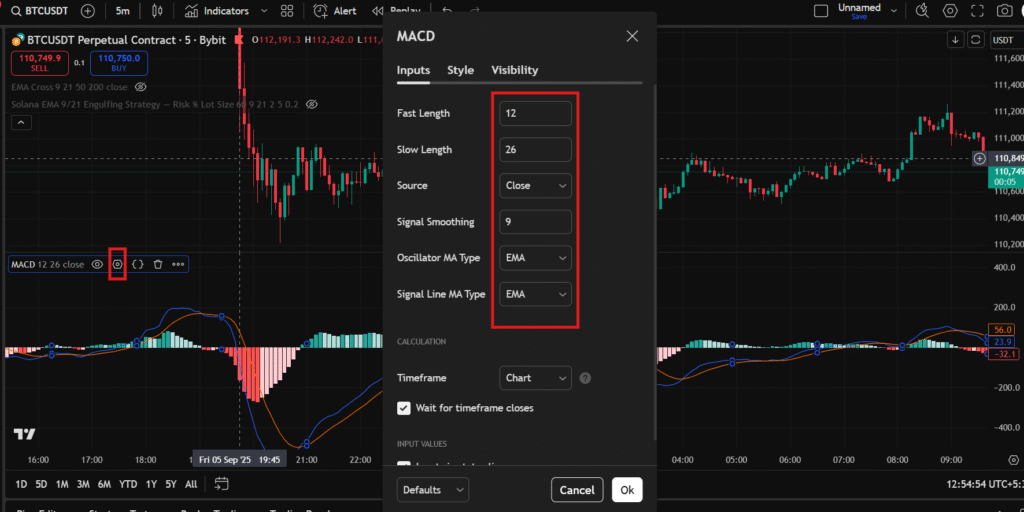
Default settings (12, 26, 9) work well for many, but customization is key to aligning MACD with your trading style.
In the indicator settings panel, you can adjust the lengths of the EMAs and the signal line. For shorter timeframes like 5-minute charts, try 8, 17, 9 to capture quick moves.
You can also change colors, line styles, and even add alerts. Set up notifications for crossovers via email or app push, perfect for busy traders monitoring multiple assets.
Remember, over-customization can lead to curve-fitting, where the indicator performs well historically but fails in live markets. Test changes on TradingView’s replay feature to validate them.
Interpreting MACD Signals
Once set up, reading MACD signals becomes intuitive. The indicator provides clear visual cues for market shifts.
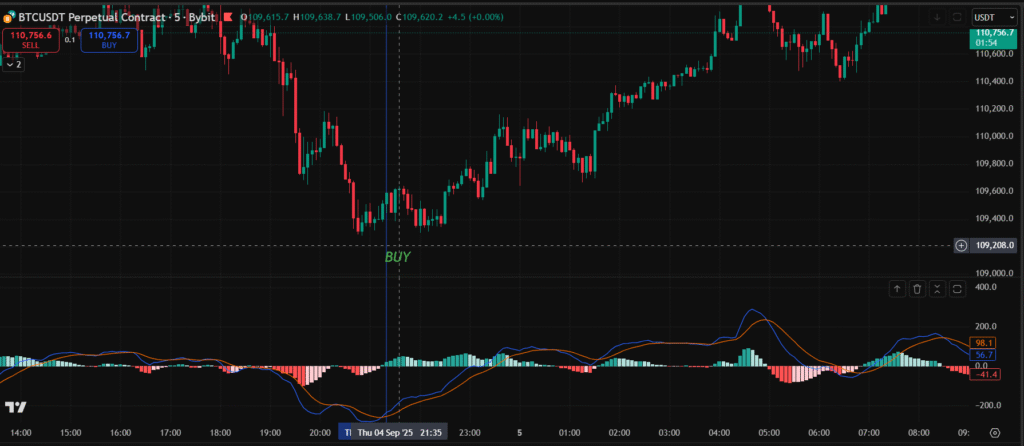
Crossovers are the most basic signal. A bullish crossover occurs when the MACD line crosses above the signal line, suggesting it’s time to buy. Conversely, a bearish crossover (MACD below signal) signals a potential sell.
These work best in trending markets. In ranging conditions, they might produce false signals, so always confirm with price action.
Divergences offer deeper insights. A bullish divergence happens when the price makes lower lows, but the MACD forms higher lows, indicating weakening bearish momentum and a possible reversal.
Bearish divergence is the opposite: higher highs in price but lower highs in MACD, warning of an impending downturn. On TradingView, zoom in on historical charts to spot these patterns in real assets like SOLUSD.
Analyzing the MACD Histogram
The histogram is often overlooked but packs a punch. Growing bars above zero show increasing bullish momentum, ideal for riding uptrends.
Shrinking bars suggest momentum is fading, even if the trend continues, a heads-up to tighten stops. When the histogram flips from positive to negative, it confirms crossovers.
Advanced traders watch for “zero line crosses,” where the MACD line itself crosses the zero level. Above zero indicates overall bullishness; below, bearish.
Combining these elements, MACD becomes a multifaceted tool. Practice on TradingView’s paper trading mode to build pattern recognition skills.
Basic Trading Strategies with MACD
Let’s put theory into practice with actionable strategies. The simplest is the MACD crossover strategy.
Buy when the MACD crosses above the signal line and the histogram turns positive. Sell on the reverse. Add a filter like requiring the crossover above the zero line for stronger bullish signals.
This strategy shines in trending markets. For example, in a bull run on the S&P 500, it could capture multiple entry points.
To manage risk, set stop-losses below recent lows and take profits at resistance levels. Always use position sizing- never risk more than 1-2% of your capital per trade.
Combining MACD with Other Indicators
MACD alone is powerful, but pairing it with others reduces false signals. Try it with the Relative Strength Index (RSI) for overbought/oversold confirmation.
If MACD shows a bullish crossover but RSI is above 70 (overbought), you might skip the trade to avoid pullbacks.
Volume indicators like On-Balance Volume (OBV) can validate MACD moves. Rising volume with a bullish MACD signal strengthens the case for entry.
On TradingView, layer these indicators on one chart. For crypto traders, combine MACD with Bollinger Bands: buy on MACD crossovers near the lower band.
Read: Best crypto trading platforms
Advanced MACD Techniques
For seasoned traders, explore multi-timeframe analysis. Use MACD on a daily chart for overall trend, then switch to hourly for precise entries.
The “MACD Histogram Slope” technique watches the histogram’s direction. Upward slopes signal building momentum, even before crossovers.
In forex, apply MACD to multiple pairs for correlation trading. If EUR/USD and GBP/USD show divergent MACD signals, it might indicate a pairs trade opportunity.
TradingView’s scripting language, Pine Script, lets you code custom MACD variants. For instance, add divergence alerts automatically.
Common Mistakes When Using MACD
Even pros slip up with MACD. One pitfall is ignoring the market context, using it in sideways markets leads to whipsaws.
Another is over-relying on defaults without backtesting. Always test settings on historical data via TradingView’s strategy tester.
Failing to incorporate risk management is deadly. MACD signals aren’t foolproof; combine with stop-losses and diversification.
Lastly, avoid emotional trading. A signal might look perfect, but if it contradicts your plan, sit it out.
Tips for Maximizing MACD on TradingView
To get the most out of MACD, use TradingView’s social features. Follow charts shared by experienced traders showcasing MACD setups.
Set up watchlists with MACD alerts for your favorite assets. This keeps you informed without constant monitoring.
Stay updated on market news, as fundamentals can override technical signals. TradingView integrates news feeds for this.
Practice discipline: journal your MACD trades to review what works. Over time, this refines your edge.
Real-World Examples and Case Studies
Consider a 2023 Bitcoin rally. In early March, MACD on the daily chart showed a bullish crossover above zero, with expanding histogram bars. Traders entering then rode the wave to $30,000.
In contrast, during the 2022 stock market dip, MACD divergences on Tesla warned of reversals. Price hit new highs in January, but MACD lower highs signaled weakness, preceding a drop.
For forex, the USD/JPY pair in 2024 exhibited a classic bearish divergence. As price climbed, MACD faltered, leading to a sharp yen strengthening.
These examples, viewable on TradingView’s historical charts, illustrate MACD’s predictive power across assets.
Pros and Cons of the MACD Indicator
MACD’s strengths include its simplicity and versatility. It’s lagging but effective for confirming trends, not predicting them outright.
Drawbacks? It can lag in fast reversals and produce false signals in choppy markets. No indicator is perfect, use it as part of a toolkit.
Compared to oscillators like Stochastic, MACD excels in trending environments but may underperform in ranges.
MACD in Different Market Conditions
In bull markets, focus on bullish crossovers and positive histograms to stay long. Avoid shorting unless divergences appear.
Bear markets favor bearish signals. Use MACD to time short entries during downtrends.
In volatile crypto markets, shorten periods for responsiveness. For stable stocks, stick to defaults.
Adapting to conditions ensures MACD remains relevant.
Integrating MACD into Your Trading Plan
Start by defining your goals: scalping, swing trading, or investing? Tailor MACD accordingly.
Backtest strategies on TradingView, input your rules and see simulated performance.
Monitor win rates and adjust. A good plan includes entry and exit rules, risk parameters, and review processes.
The Future of MACD and TradingView Innovations
As trading evolves, so does MACD usage. With AI and machine learning, TradingView might introduce predictive MACD variants.
Stay ahead by exploring community ideas. The platform’s updates often enhance indicator functionality.
In 2025, with markets more interconnected, MACD’s role in multi-asset analysis grows.
Conclusion: Elevate Your Trading with MACD on TradingView
The MACD indicator is a timeless tool that empowers traders to navigate markets with greater precision. From understanding its components to applying advanced strategies, integrating MACD on TradingView can transform your approach.
Remember, success comes from practice, patience, and continuous learning. Start small, test thoroughly, and let MACD guide your decisions. Happy trading!
Read: Mastering the CM_Ultimate RSI Multi Time Frame Tradingview Indicator
Contents
- 1 MACD Indicator Explained
- 2 What is the MACD Indicator?
- 3 Key Components of the MACD Indicator
- 4 How is MACD Calculated?
- 5 Setting Up MACD on TradingView
- 6 Customizing Best MACD Settings for Your Strategy
- 7 Interpreting MACD Signals
- 8 Analyzing the MACD Histogram
- 9 Basic Trading Strategies with MACD
- 10 Combining MACD with Other Indicators
- 11 Advanced MACD Techniques
- 12 Common Mistakes When Using MACD
- 13 Tips for Maximizing MACD on TradingView
- 14 Real-World Examples and Case Studies
- 15 Pros and Cons of the MACD Indicator
- 16 MACD in Different Market Conditions
- 17 Integrating MACD into Your Trading Plan
- 18 The Future of MACD and TradingView Innovations
- 19 Conclusion: Elevate Your Trading with MACD on TradingView

